The Marcellus Play: A Look At Where We Are Today SunTrust 11th Annual Appalachian Conference Bill Zagorski VP, Geology August 23, 2016 1
Appalachian Basin Production Trends Circa 2000 The Appalachians circa 2000 was focused nearly entirely on the regional development of regional tight sandstone plays in PA, WV, OH, KY and NY. Nearly all drilling was vertical.…
Marcellus Shale Play 2004 through Present Here is what the Appalachian Basin looks like now focusing on the Marcellus and to a lesser extent the Upper Devonian Shales. All of this horizontal coverage has been developed from 2007…
Gas In Place (GIP) Marcellus Shale GIP is a function of pressure, temperature, thermal maturity, porosity, hydrocarbon saturation and net thickness Two core areas have been developed in the Marcellus Condensate and NGLs are…
Total Gas In Place Marcellus Shale Gas in place is a huge driver in the core areas of the Marcellus play. Range recognized this early and focused acquisition and drilling in areas of highest Marcellus GIP. Well quality and…
Marcellus Stratigraphy Differs by Core Area 6
Key Play Driver Pressure Gradient Early mapping of pressure gradient trends critical. Areas of highest over pressure nicely match areas of highest GIP and core well performance. Whats driving the pressure gradient trends 7
Marcellus Thermal Maturity Trends Thermal maturity is driving the degree of over pressure. Thermal maturity driven by depth of burial, time, temperature and seal integrity. Core Marcellus areas in the SW lie in thermal…
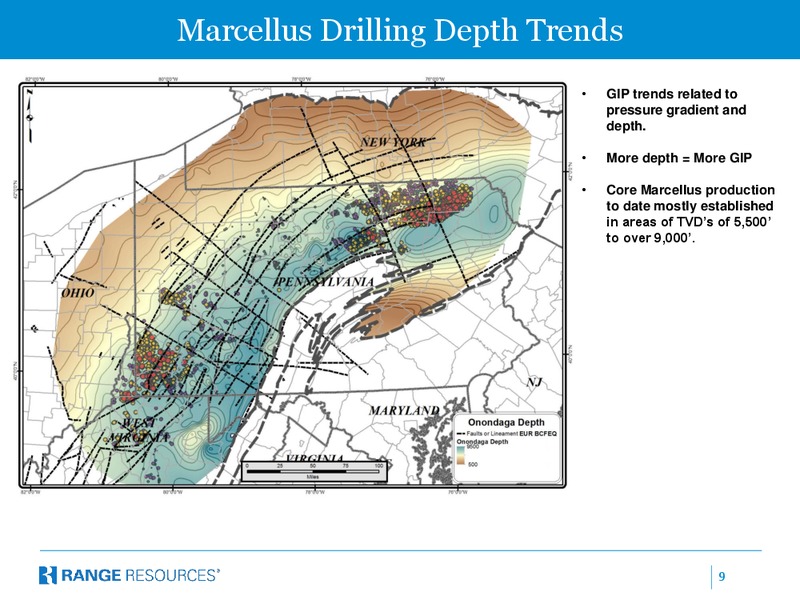
Marcellus Drilling Depth Trends GIP trends related to pressure gradient and depth. More depth = More GIP Core Marcellus production to date mostly established in areas of TVDs of 5,500 to over 9,000. 9
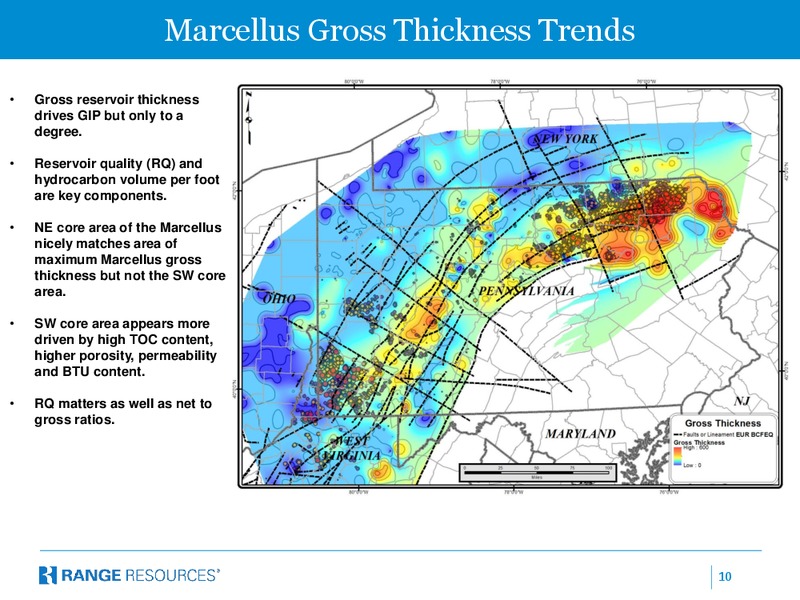
Marcellus Gross Thickness Trends Gross reservoir thickness drives GIP but only to a degree. Reservoir quality (RQ) and hydrocarbon volume per foot are key components. NE core area of the Marcellus nicely matches area of…
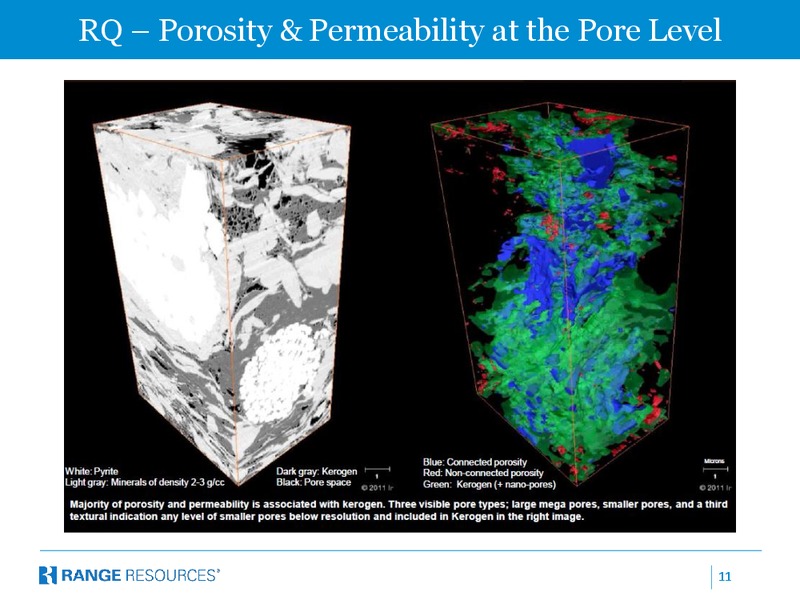
RQ Porosity & Permeability at the Pore Level 11
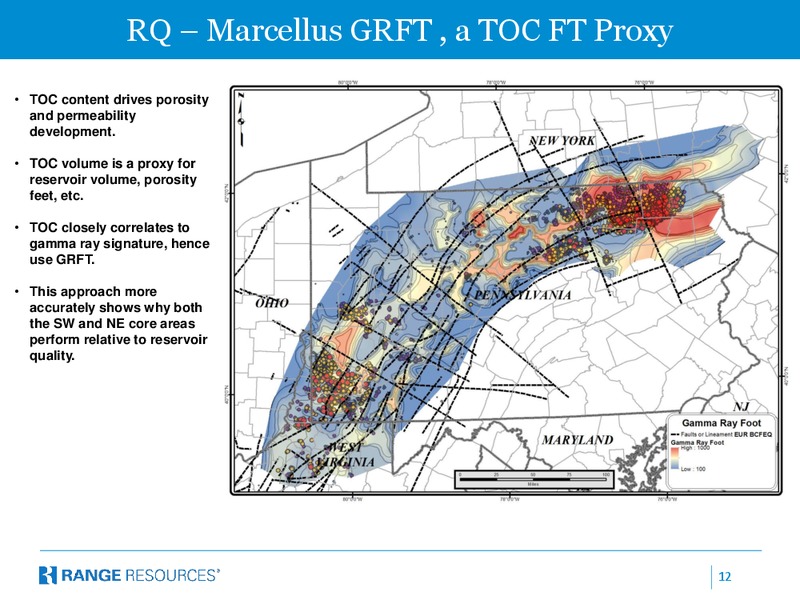
RQ Marcellus GRFT , a TOC FT Proxy TOC content drives porosity and permeability development. TOC volume is a proxy for reservoir volume, porosity feet, etc. TOC closely correlates to gamma ray signature, hence use GRFT.…
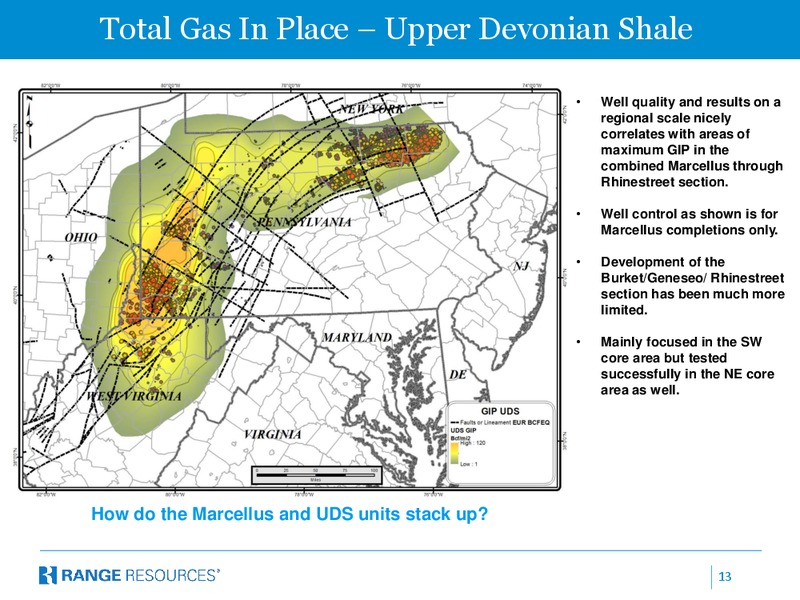
Total Gas In Place Upper Devonian Shale Well quality and results on a regional scale nicely correlates with areas of maximum GIP in the combined Marcellus through Rhinestreet section. Well control as shown is for Marcellus…
Total Gas In Place Marcellus and Upper Devonian Shale Combining the GIP estimates for both the Marcellus/UDS matches best with the SW and NE core areas as well as most industry activity. Well control as shown is for Marcellus…
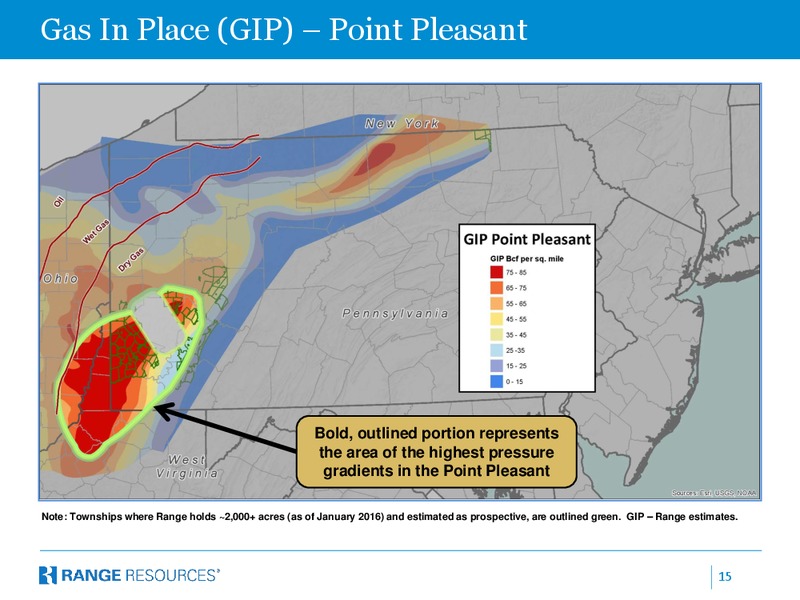
Gas In Place (GIP) Point Pleasant Bold, outlined portion represents the area of the highest pressure gradients in the Point Pleasant Note: Townships where Range holds 2,000+ acres (as of January 2016) and estimated as prospective,…
Gas In Place (GIP) Analysis Shows Greatest Potential in SW PA When GIP analysis from the Marcellus, Upper Devonian and Point Pleasant are combined, the largest stacked pay resource is located in SW PA where Range has concentrated…
Largest Gas Worldwide Gas Fields Gas In Place When comparing the GIP calculations for the top 15 gas fields in the world to the GIP calculations from the combined Marcellus/UDS sequence, the Marcellus/UDS is significantly higher…
Largest Gas Worldwide Gas Fields Here are the figures. Totaling the GIP for all top giant fields 7,608 TCF Totaling all of the conventional giant fields 3,910 TCF Totaling the combined Marcellus/UDS shale play 3,698 TCF What…
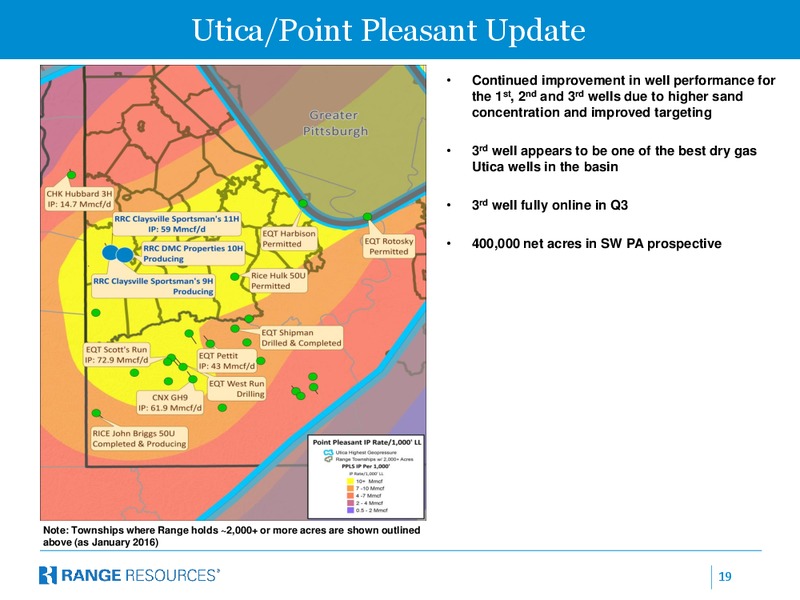
Utica/Point Pleasant Update Continued improvement in well performance for the 1st, 2nd and 3rd wells due to higher sand concentration and improved targeting 3rd well appears to be one of the best dry gas Utica wells in the basin…
Utica Wells Wellhead Pressure vs. Cumulative Production Early Time Production Data (Including Flowback/Test Data) 30 Mmcfd 10,000 25 Mmcfd 13,200 ft. TVD* 20 Mmcfd 8,000 13,400 ft. TVD* Wellhead Pressure (psi) 18 Mmcfd…
 Loading...