September 2016 Roadshow Presentation H1 Financial Results 2016 CGG Roadmap All results are presented before Non-Recurring Charges & write-off, unless stated otherwise
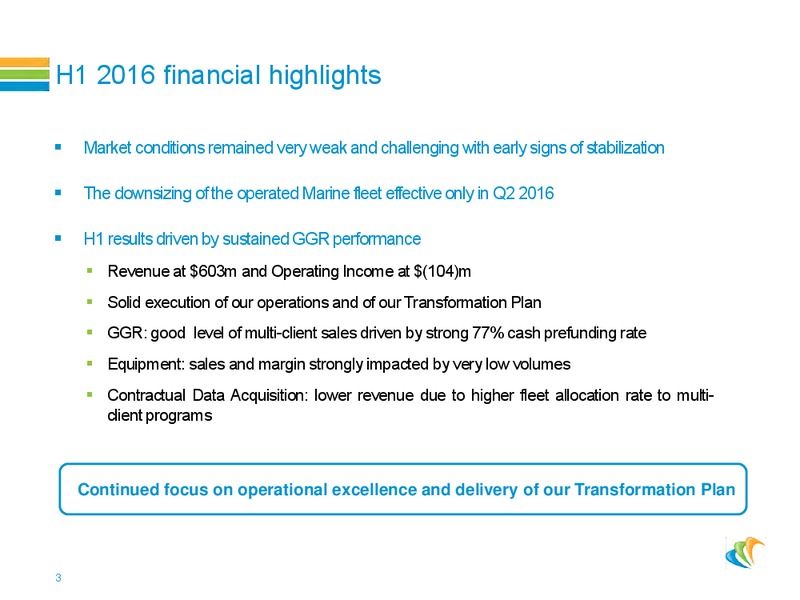
H1 2016 financial highlights Market conditions remained very weak and challenging with early signs of stabilization The downsizing of the operated Marine fleet effective only in Q2 2016 H1 results driven by sustained GGR…
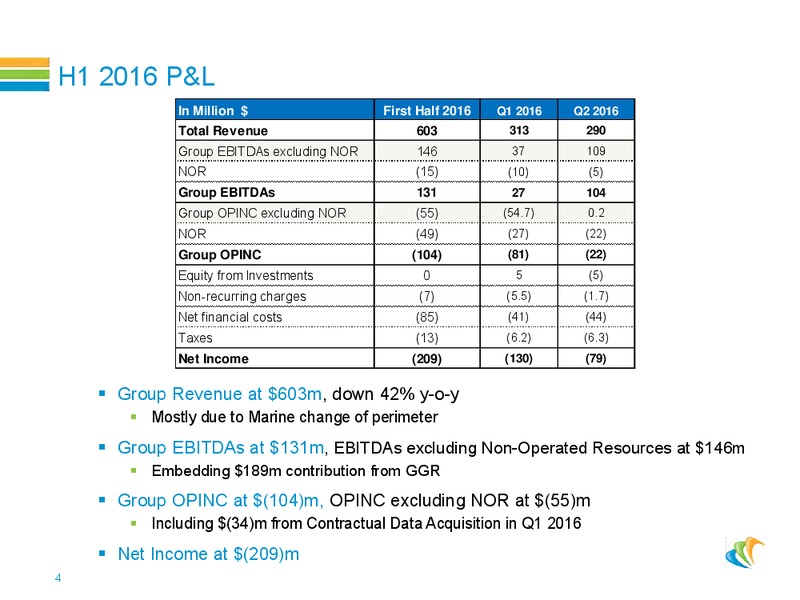
H1 2016 P&L In Million First Half 2016 Q1 2016 Q2 2016 Total Revenue 603 313 290 Group EBITDAs excluding NOR 146 37 109 NOR (15) (10) (5) Group EBITDAs 131 27 104 Group OPINC excluding NOR (55) (54.7) 0.2 NOR (49) (27) (22) Group…
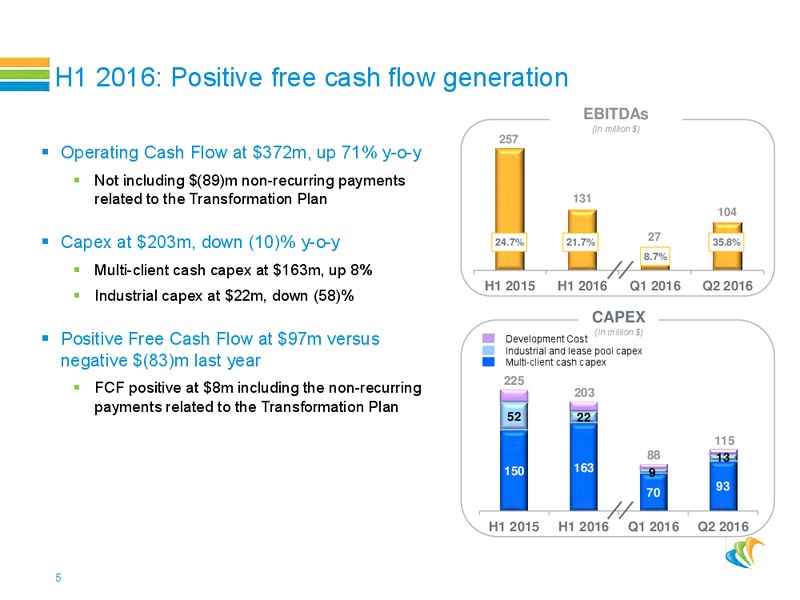
H1 2016: Positive free cash flow generation EBITDAs (In million ) 257 Operating Cash Flow at 372m, up 71% y-o-y Not including (89)m non-recurring payments related to the Transformation Plan 131 104 Capex at 203m, down (10)%…
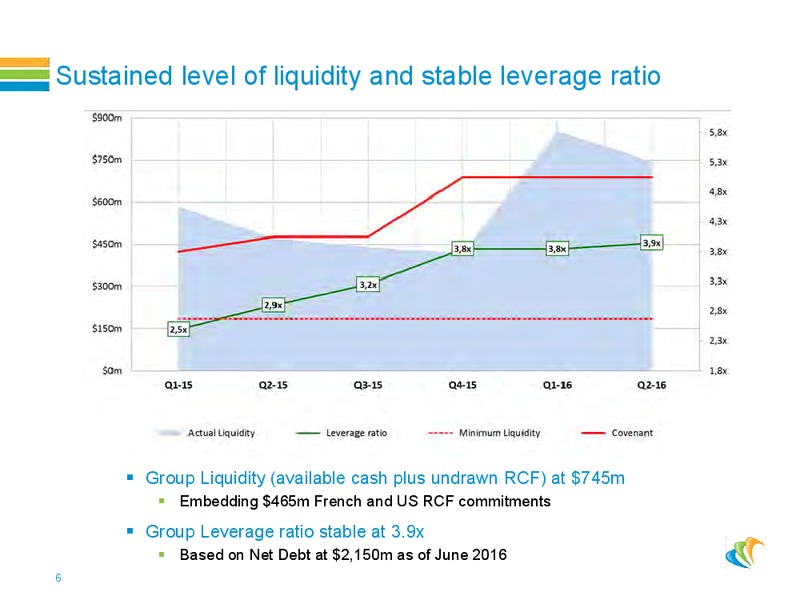
Sustained level of liquidity and stable leverage ratio Group Liquidity (available cash plus undrawn RCF) at 745m Embedding 465m French and US RCF commitments Group Leverage ratio stable at 3.9x Based on Net Debt at 2,150m as of…
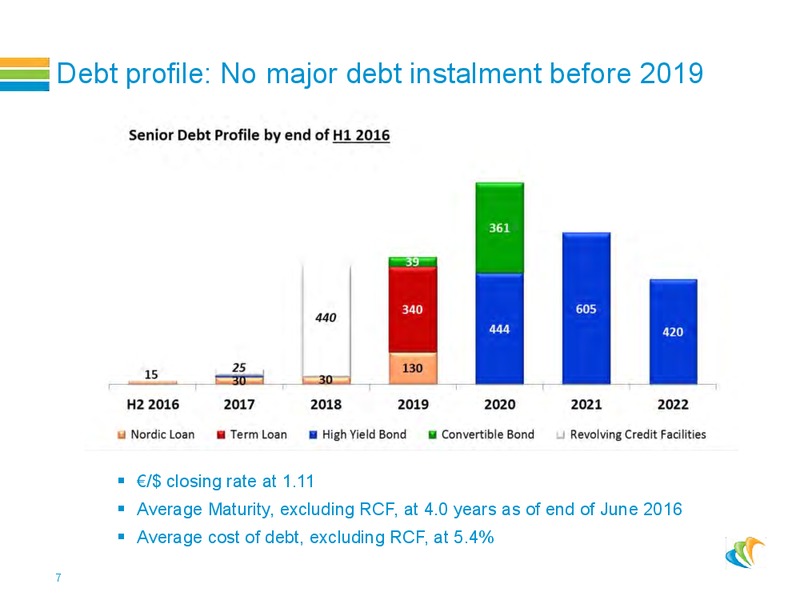
Debt profile: No major debt instalment before 2019 / closing rate at 1.11 Average Maturity, excluding RCF, at 4.0 years as of end of June 2016 Average cost of debt, excluding RCF, at 5.4% 7
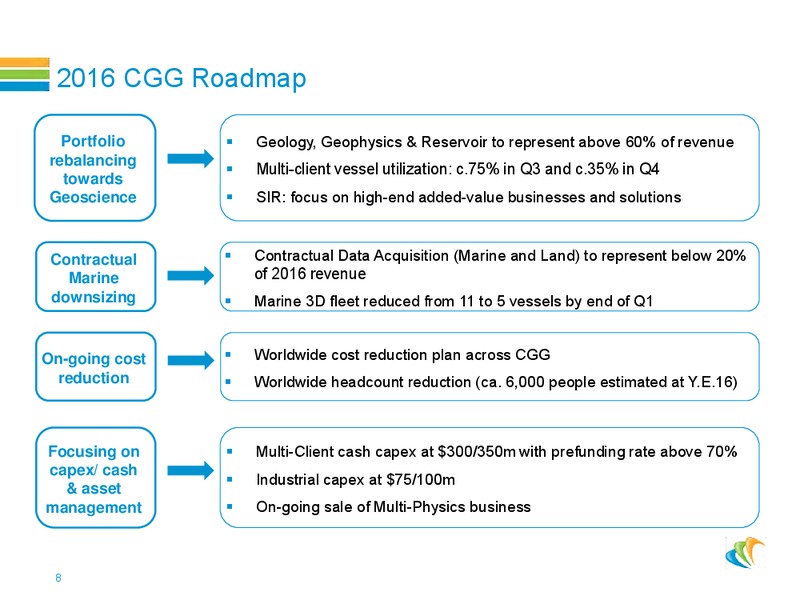
2016 CGG Roadmap Portfolio Geology, Geophysics & Reservoir to represent above 60% of revenue rebalancing Multi-client vessel utilization: c.75% in Q3 and c.35% in Q4 towards Geoscience SIR: focus on high-end added-value businesses…
Our vision for CGG 9
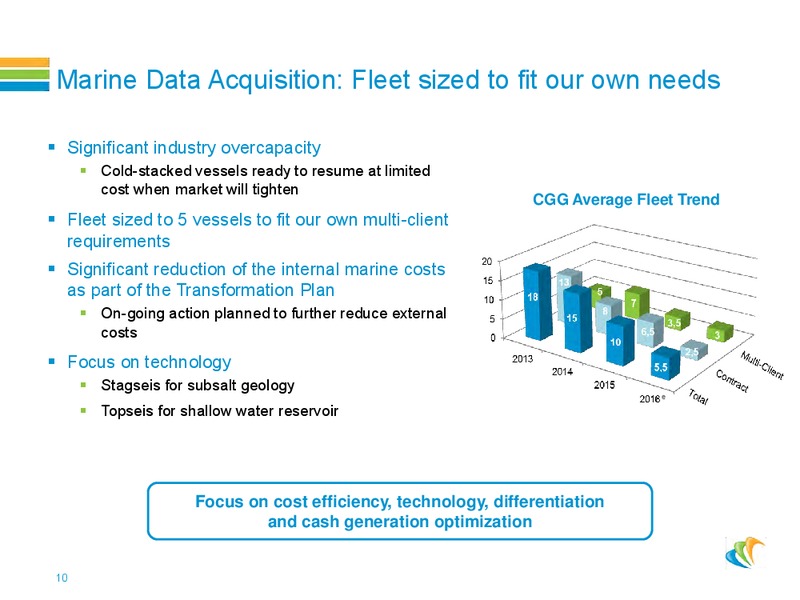
Marine Data Acquisition: Fleet sized to fit our own needs Significant industry overcapacity Cold-stacked vessels ready to resume at limited cost when market will tighten CGG Average Fleet Trend Fleet sized to 5 vessels to fit our…
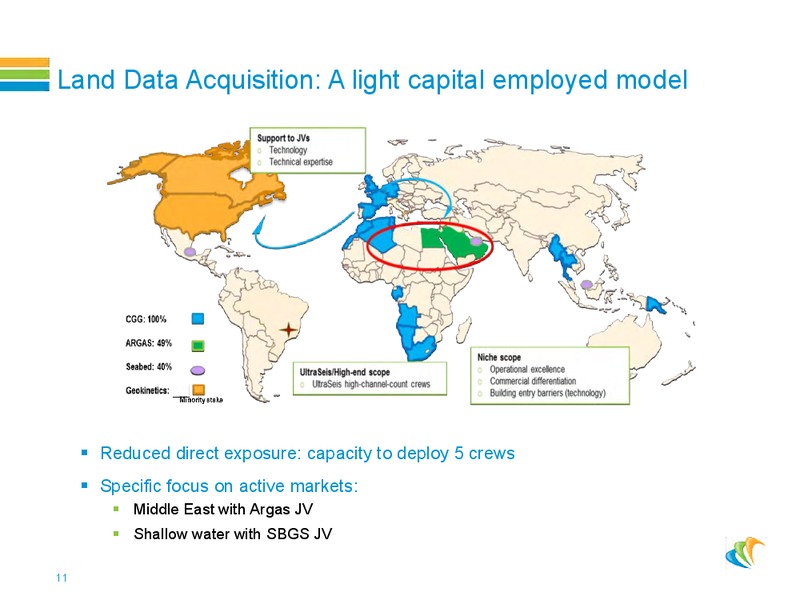
Land Data Acquisition: A light capital employed model Reduced direct exposure: capacity to deploy 5 crews Specific focus on active markets: Middle East with Argas JV Shallow water with SBGS JV 11
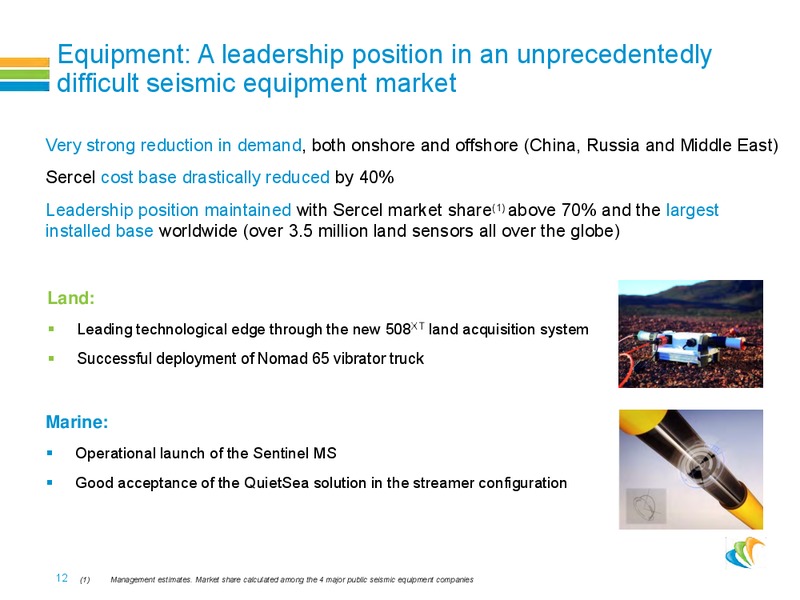
Equipment: A leadership position in an unprecedentedly difficult seismic equipment market Very strong reduction in demand, both onshore and offshore (China, Russia and Middle East) Sercel cost base drastically reduced by 40% Leadership…
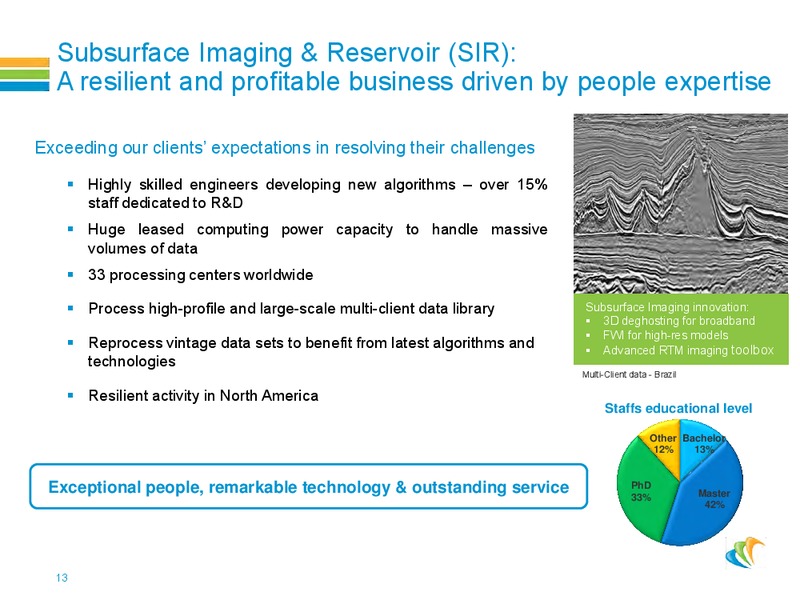
Subsurface Imaging & Reservoir (SIR): A resilient and profitable business driven by people expertise Exceeding our clients expectations in resolving their challenges Highly skilled engineers developing new algorithms over 15% staff…
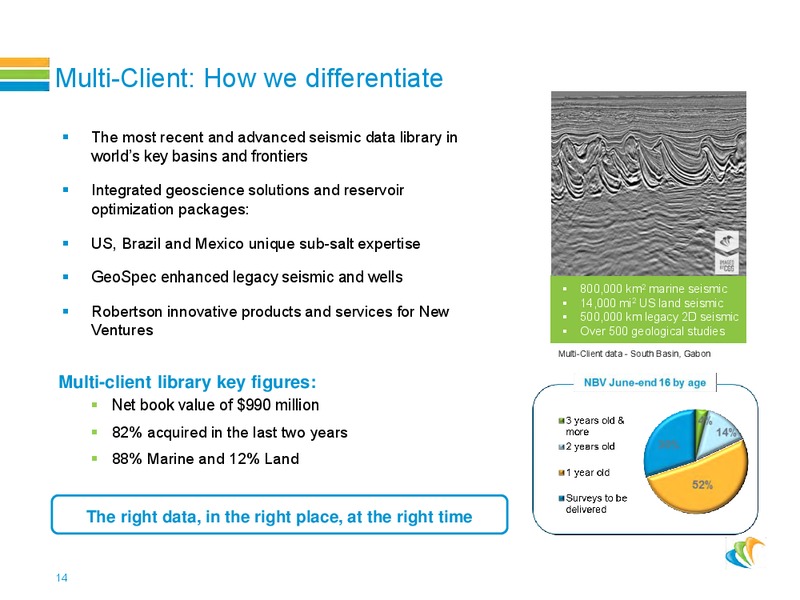
Multi-Client: How we differentiate The most recent and advanced seismic data library in worlds key basins and frontiers Integrated geoscience solutions and reservoir optimization packages: US, Brazil and Mexico unique sub-salt…
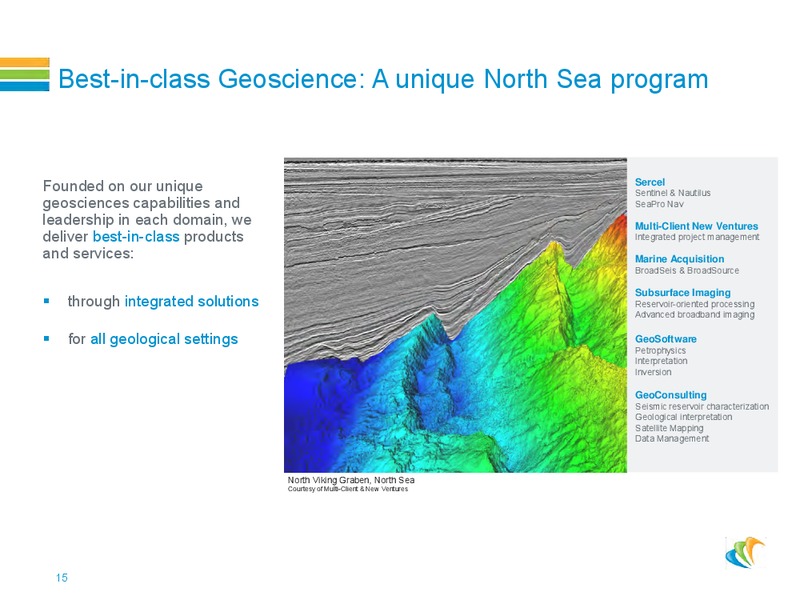
Best-in-class Geoscience: A unique North Sea program Founded on our unique Sercel Sentinel & Nautilus geosciences capabilities and SeaPro Nav leadership in each domain, we Multi-Client New Ventures deliver best-in-class products…
Conclusion
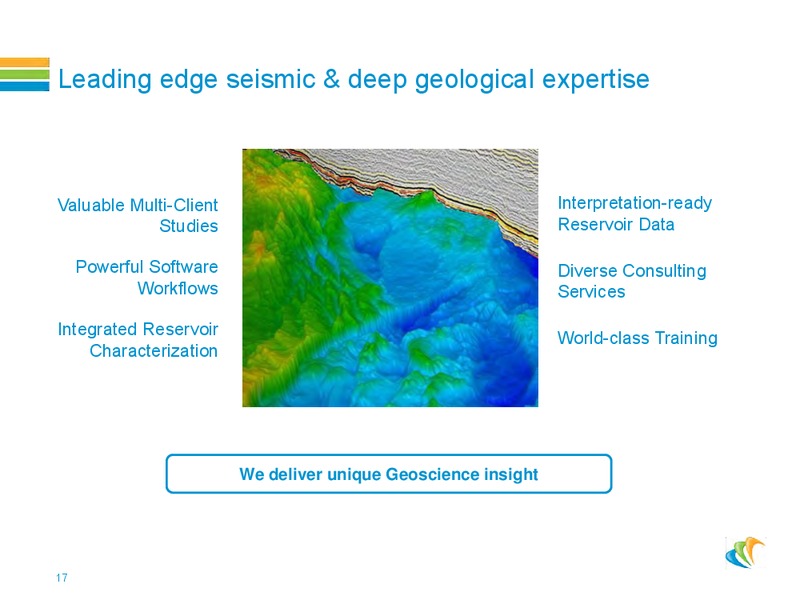
Leading edge seismic & deep geological expertise Valuable Multi-Client Interpretation-ready Studies Reservoir Data Powerful Software Diverse Consulting Workflows Services Integrated Reservoir World-class Training…
Focus on operational excellence, execution of our Transformation Plan and cash generation Market remains challenging with very low pricing and reduced volumes but seems to be stabilizing with early signs of change in client sentiment…
Thank you
Q2 Operational Review 20
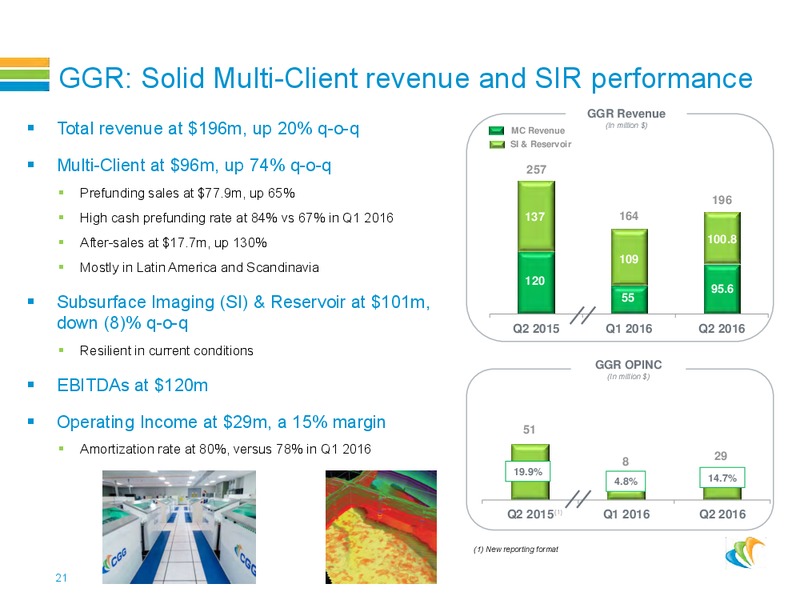
GGR: Solid Multi-Client revenue and SIR performance GGR Revenue Total revenue at 196m, up 20% q-o-q MC Revenue (In million ) SI & Reservoir Multi-Client at 96m, up 74% q-o-q 257 Prefunding sales at 77.9m, up 65% 196 High cash…
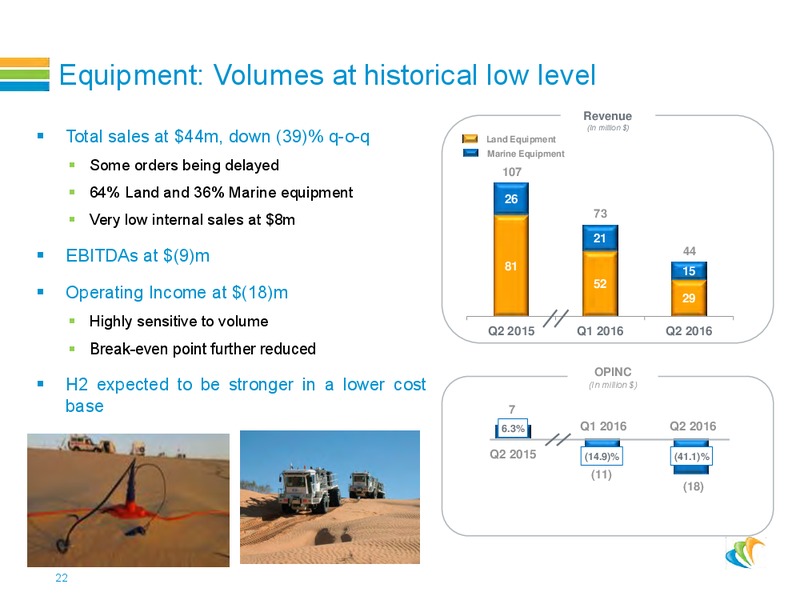
Equipment: Volumes at historical low level Revenue (In million ) Total sales at 44m, down (39)% q-o-q Land Equipment Marine Equipment Some orders being delayed 107 64% Land and 36% Marine equipment 26 73 Very low internal sales…
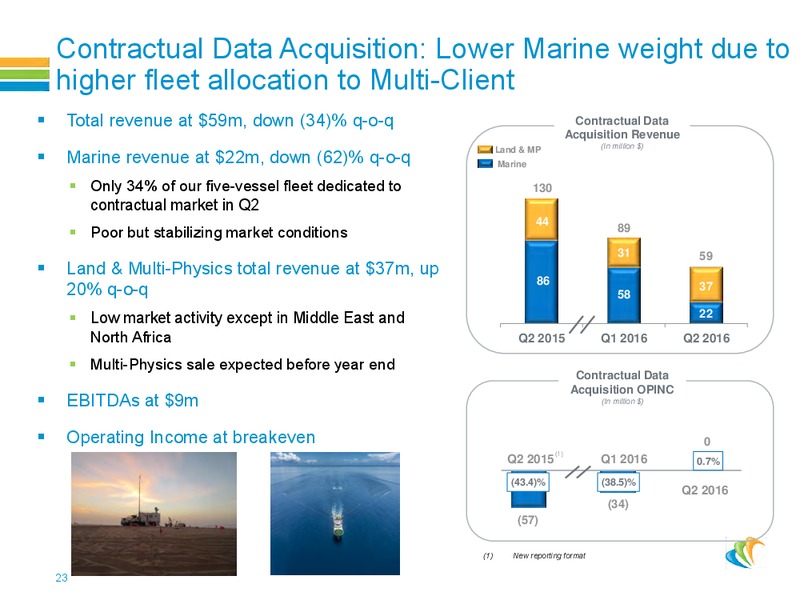
Contractual Data Acquisition: Lower Marine weight due to higher fleet allocation to Multi-Client Total revenue at 59m, down (34)% q-o-q Contractual Data Acquisition Revenue (In million ) Marine revenue at 22m, down (62)% q-o-q Land…
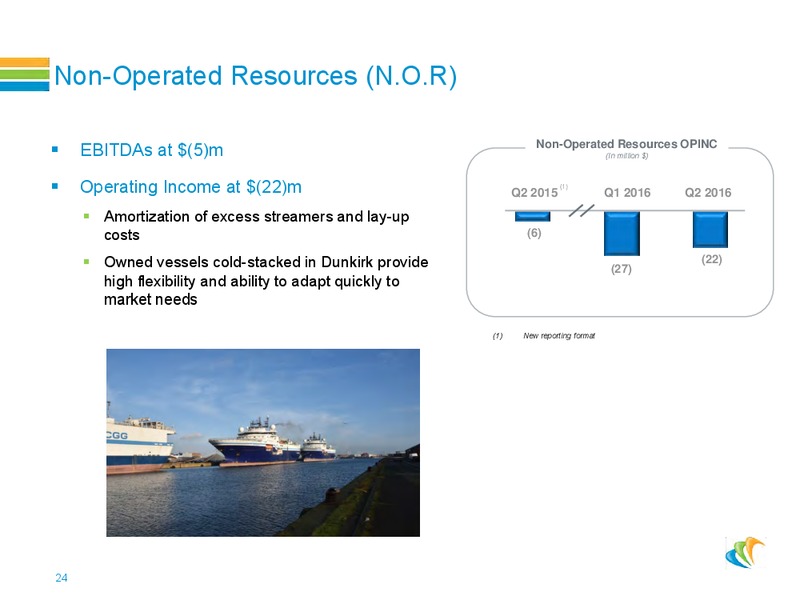
Non-Operated Resources (N.O.R) EBITDAs at (5)m Non-Operated Resources OPINC (In million ) Operating Income at (22)m Q2 2015 (1) Q1 2016 Q2 2016 Amortization of excess streamers and lay-up costs (6) Owned vessels cold-stacked…
 Loading...