Roadshow presentation Transformation Plan on track and strong cash generation Q1 2016 results strongly impacted by very low volumes Catherine Leveau, SVP Investor Relations, June 2016 All results are presented before Non-Recurring…
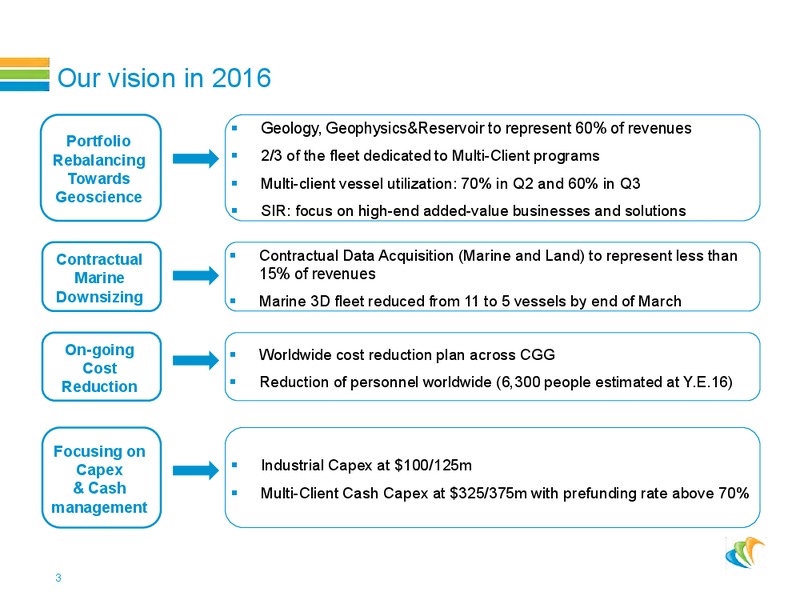
Our vision in 2016 Geology, Geophysics&Reservoir to represent 60% of revenues Portfolio Rebalancing 2/3 of the fleet dedicated to Multi-Client programs Towards Multi-client vessel utilization: 70% in Q2 and 60% in Q3 Geoscience SIR:…
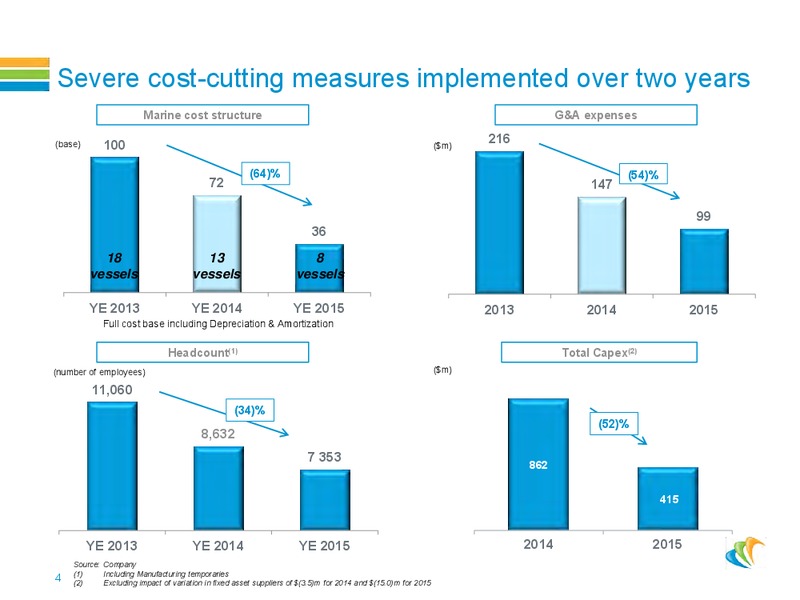
Severe cost-cutting measures implemented over two years Marine cost structure G&A expenses (base) 100 (m) 216 (64)% (54)% 72 147 99 36 18 13 8 vessels vessels vessels YE 2013 YE 2014 YE 2015 2013 2014 2015 Full cost base…
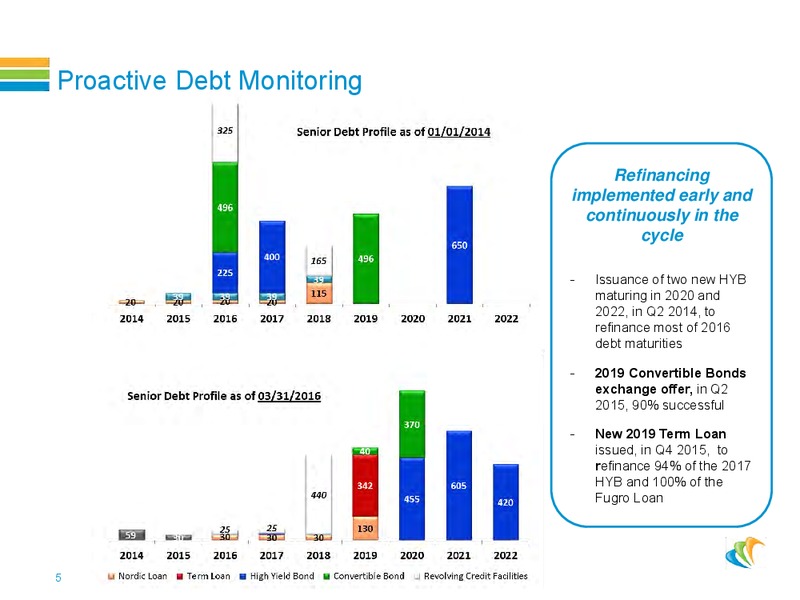
Proactive Debt Monitoring Refinancing implemented early and continuously in the cycle - Issuance of two new HYB maturing in 2020 and 2022, in Q2 2014, to refinance most of 2016 debt maturities - 2019 Convertible Bonds…
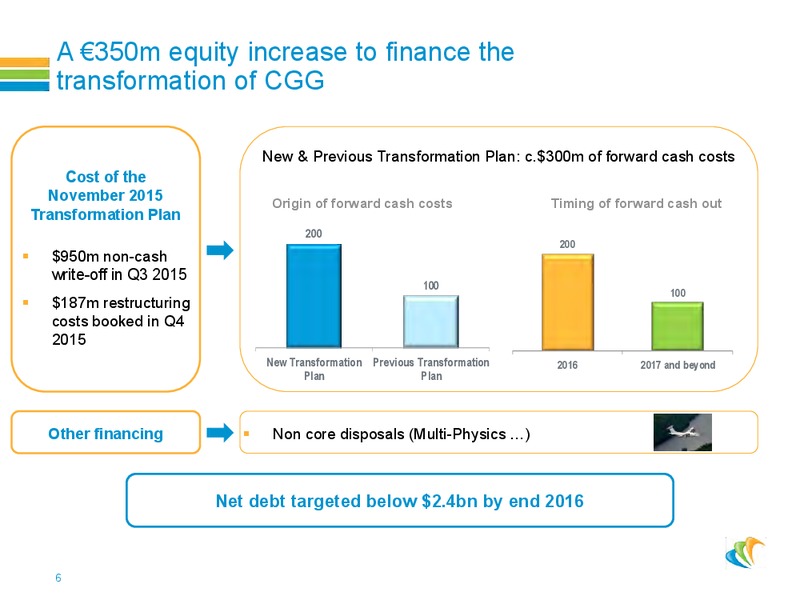
A 350m equity increase to finance the transformation of CGG New & Previous Transformation Plan: c.300m of forward cash costs Cost of the November 2015 Origin of forward cash costs Timing of forward cash out Transformation Plan…
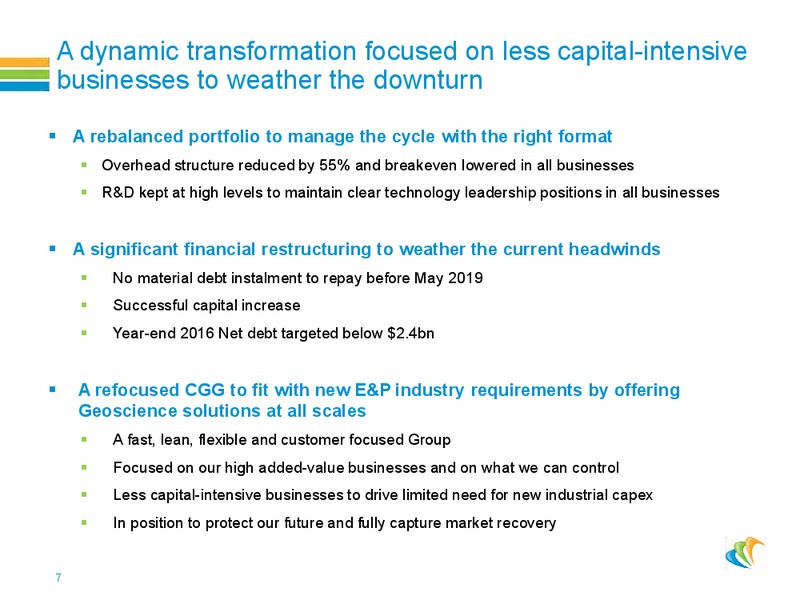
A dynamic transformation focused on less capital-intensive businesses to weather the downturn A rebalanced portfolio to manage the cycle with the right format Overhead structure reduced by 55% and breakeven lowered in all businesses…
Operational Review 8
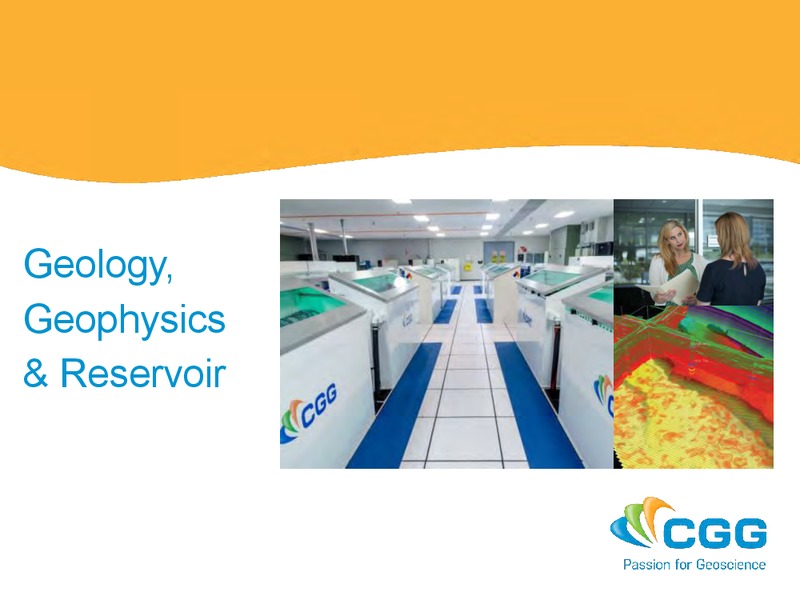
Geology, Geophysics & Reservoir
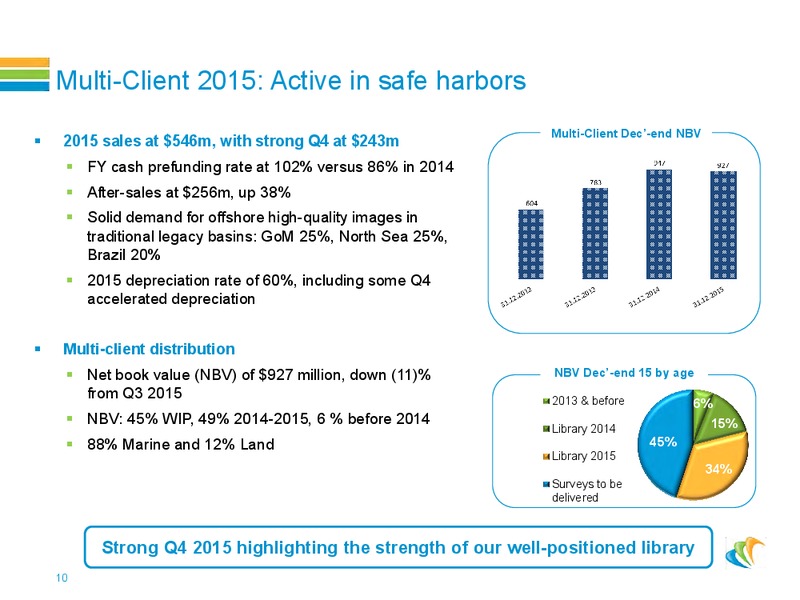
Multi-Client 2015: Active in safe harbors Multi-Client Dec-end NBV 2015 sales at 546m, with strong Q4 at 243m FY cash prefunding rate at 102% versus 86% in 2014 After-sales at 256m, up 38% Solid demand for offshore high-quality…
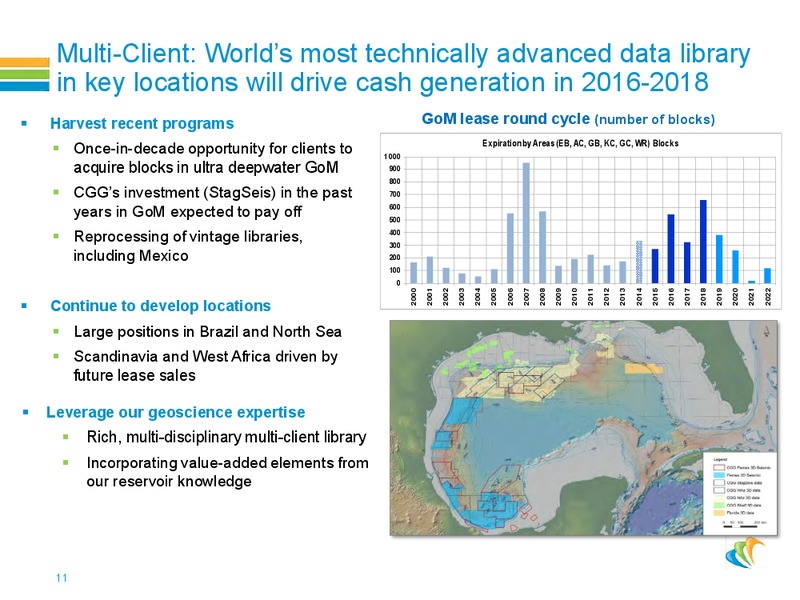
Multi-Client: Worlds most technically advanced data library in key locations will drive cash generation in 2016-2018 Harvest recent programs GoM lease round cycle (number of blocks) Expiration by Areas (EB, AC, GB, KC, GC, WR) Blocks…
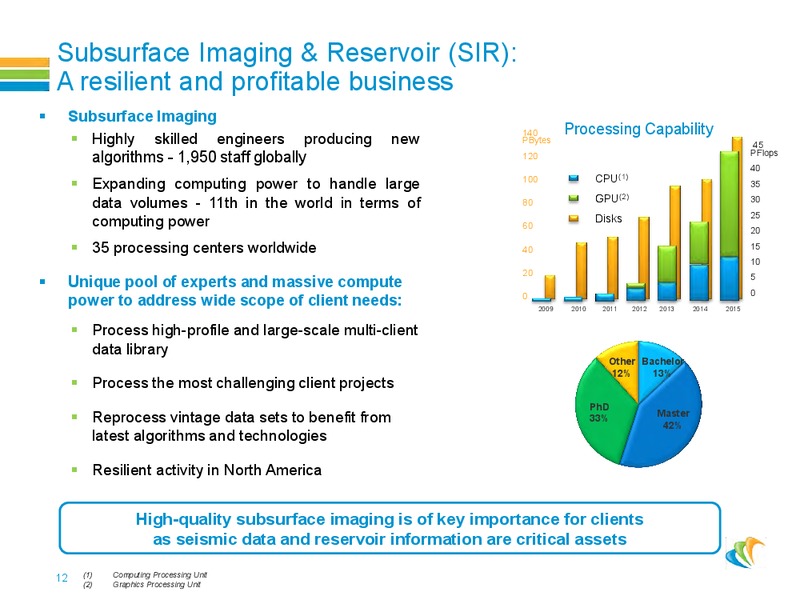
Subsurface Imaging & Reservoir (SIR): A resilient and profitable business Subsurface Imaging 140 Processing Capability Highly skilled engineers producing new PBytes 45 algorithms - 1,950 staff globally 120 PFlops 40 CPU(1)…
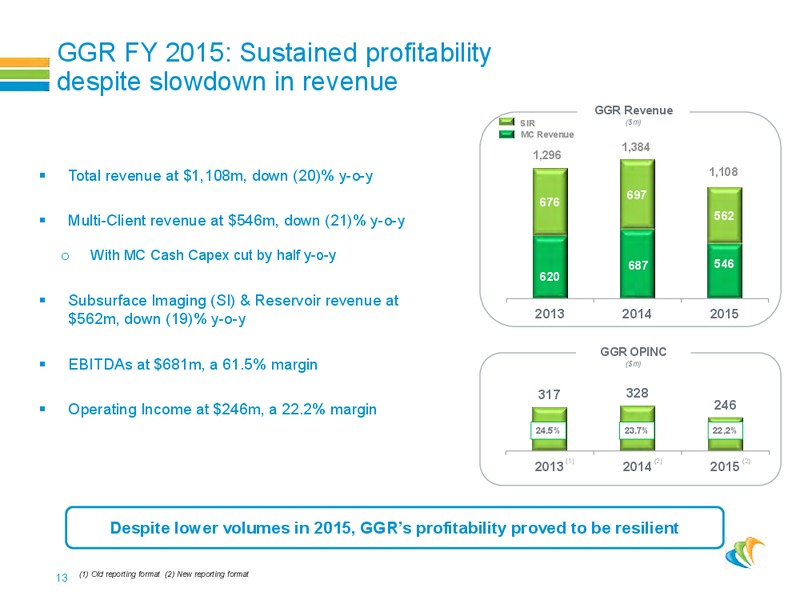
GGR FY 2015: Sustained profitability despite slowdown in revenue GGR Revenue SIR (m) MC Revenue 1,384 1,296 Total revenue at 1,108m, down (20)% y-o-y 1,108 697 676 Multi-Client revenue at 546m, down (21)% y-o-y 562 o With MC…
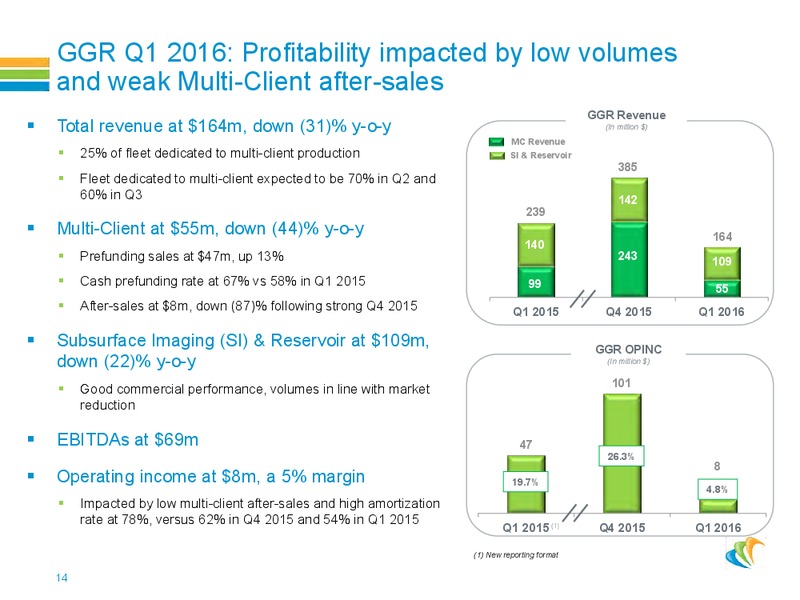
GGR Q1 2016: Profitability impacted by low volumes and weak Multi-Client after-sales GGR Revenue Total revenue at 164m, down (31)% y-o-y (In million ) MC Revenue 25% of fleet dedicated to multi-client production SI & Reservoir 385…
Equipment
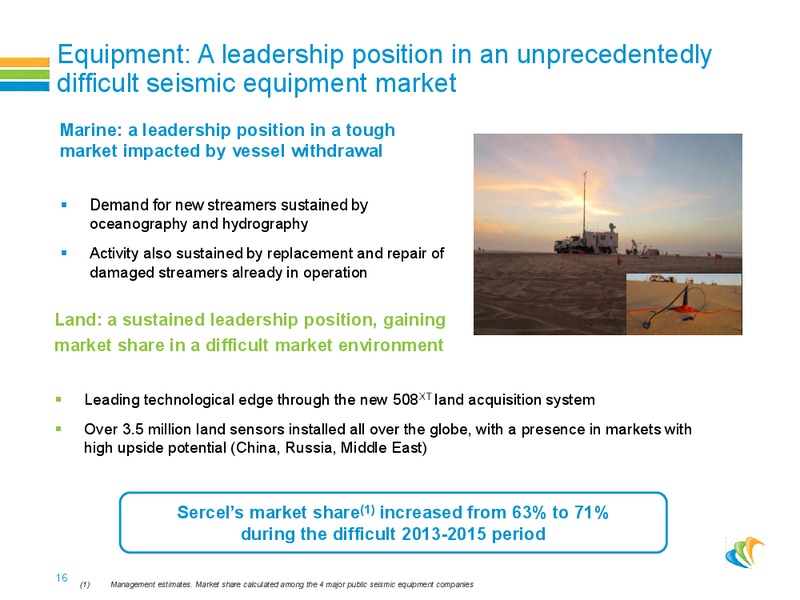
Equipment: A leadership position in an unprecedentedly difficult seismic equipment market Marine: a leadership position in a tough market impacted by vessel withdrawal Demand for new streamers sustained by oceanography and…
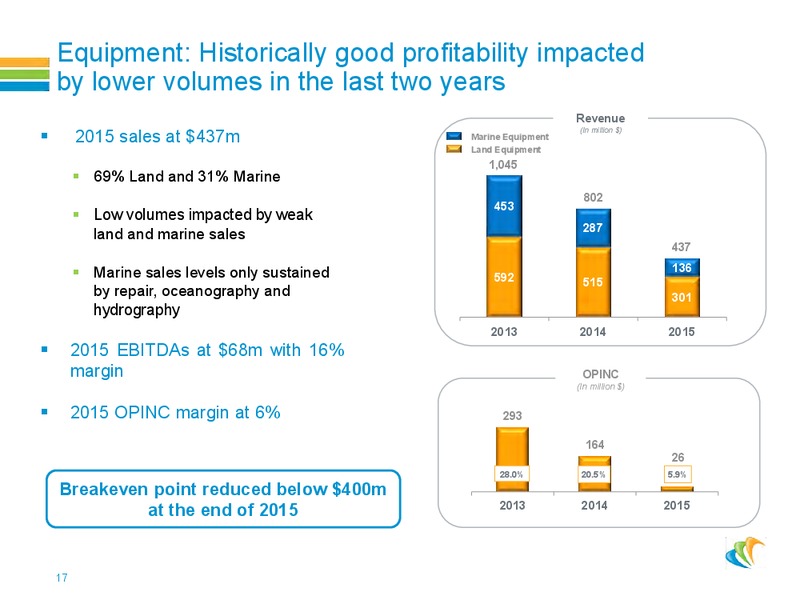
Equipment: Historically good profitability impacted by lower volumes in the last two years Revenue 2015 sales at 437m (In million ) Marine Equipment Land Equipment 1,045 69% Land and 31% Marine 802 453 Low volumes impacted by…
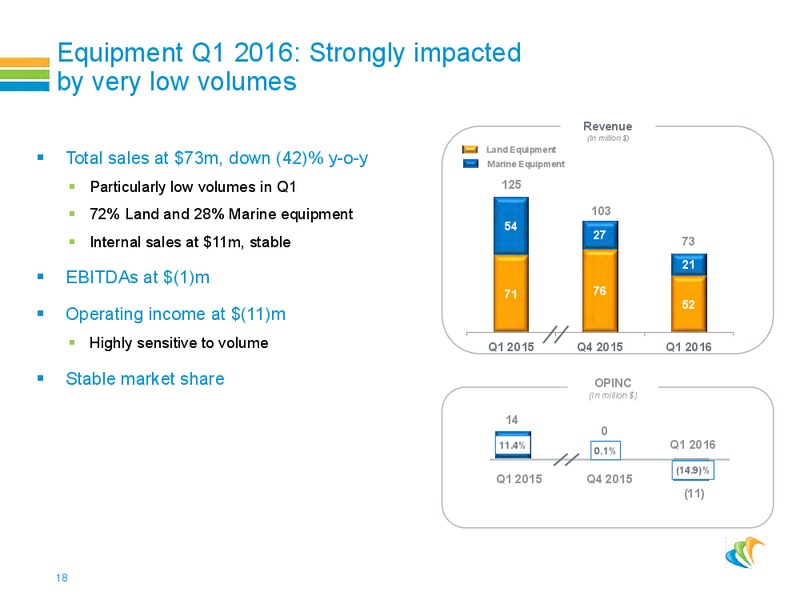
Equipment Q1 2016: Strongly impacted by very low volumes Revenue (In million ) Land Equipment Total sales at 73m, down (42)% y-o-y Marine Equipment Particularly low volumes in Q1 125 72% Land and 28% Marine equipment 103 54…
Contractual Data Acquisition
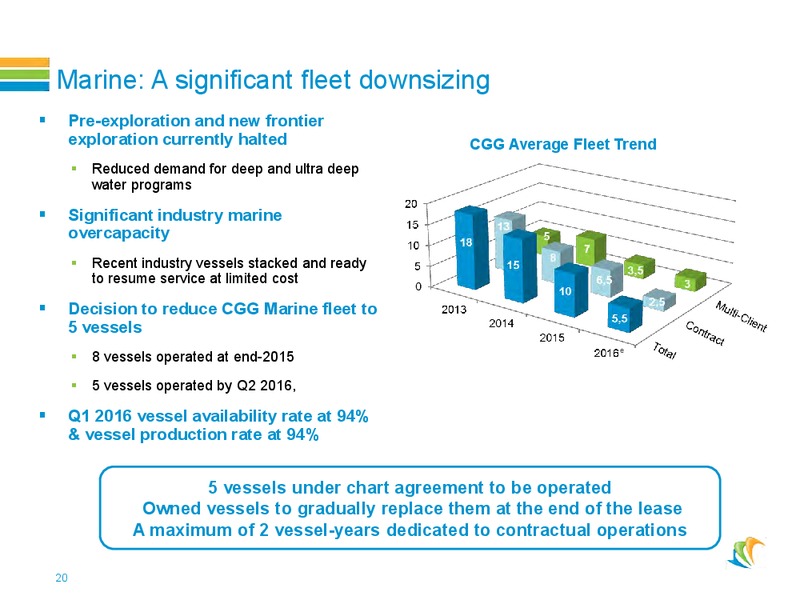
Marine: A significant fleet downsizing Pre-exploration and new frontier exploration currently halted CGG Average Fleet Trend Reduced demand for deep and ultra deep water programs Significant industry marine overcapacity Recent…
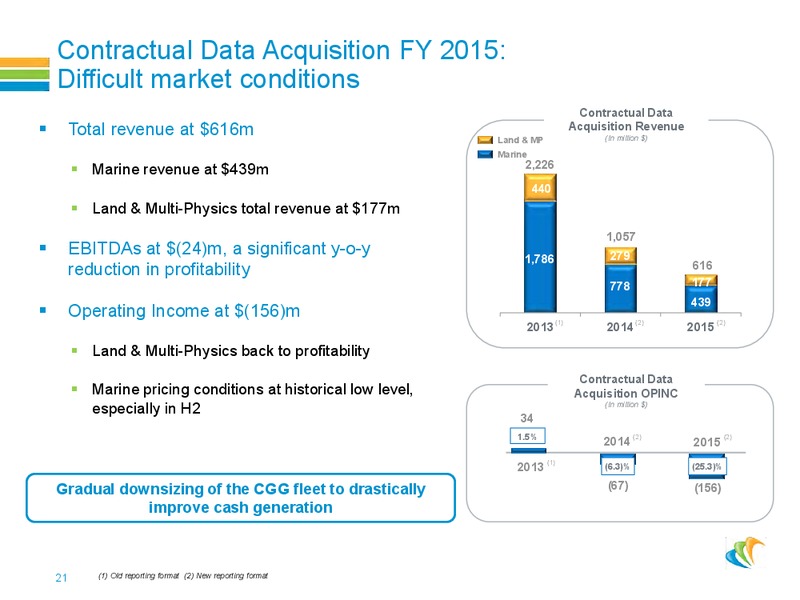
Contractual Data Acquisition FY 2015: Difficult market conditions Contractual Data Total revenue at 616m Land & MP Acquisition Revenue (In million ) Marine Marine revenue at 439m 2,226 440 Land & Multi-Physics total revenue at…
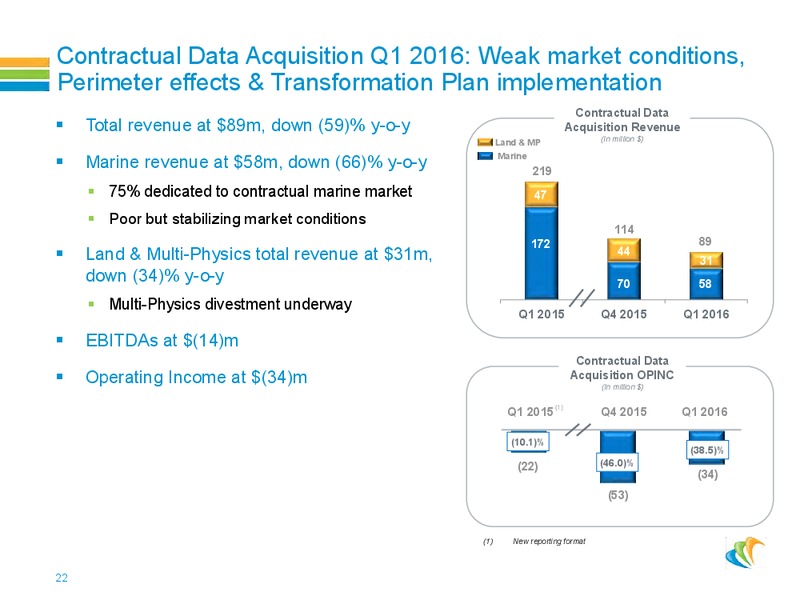
Contractual Data Acquisition Q1 2016: Weak market conditions, Perimeter effects & Transformation Plan implementation Contractual Data Total revenue at 89m, down (59)% y-o-y Acquisition Revenue (In million ) Land & MP Marine Marine…
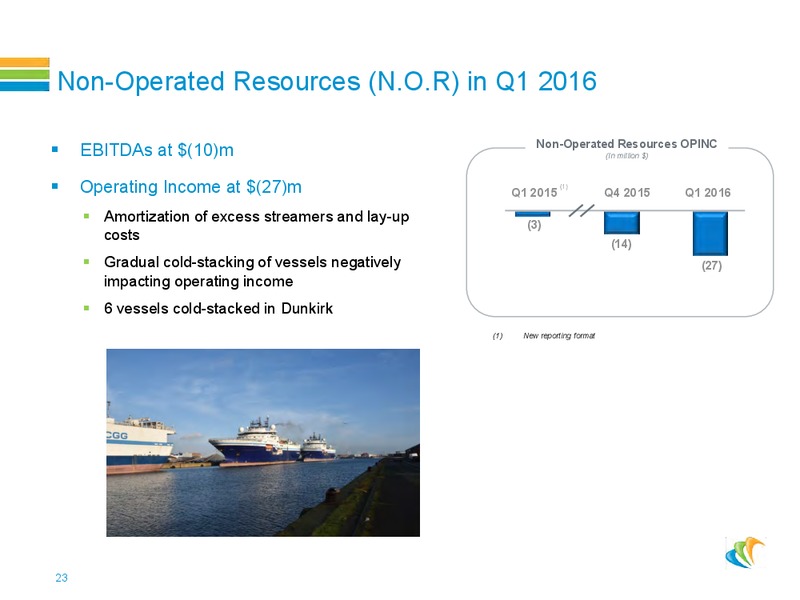
Non-Operated Resources (N.O.R) in Q1 2016 Non-Operated Resources OPINC EBITDAs at (10)m (In million ) Operating Income at (27)m Q1 2015 (1) Q4 2015 Q1 2016 Amortization of excess streamers and lay-up (3) costs (14) Gradual…
Financial Review 24
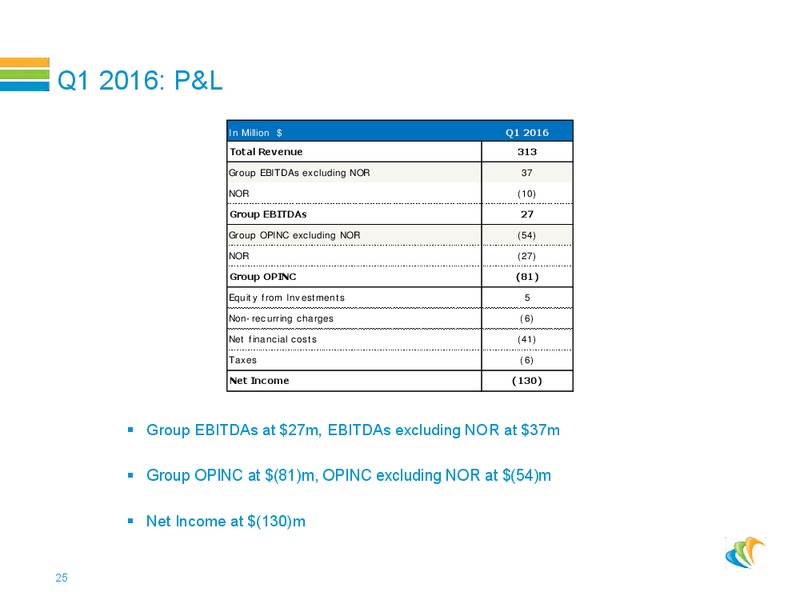
Q1 2016: P&L In Million Q1 2016 Total Revenue 313 Group EBITDAs excluding NOR 37 NOR (10) Group EBITDAs 27 Group OPINC excluding NOR (54) NOR (27) Group OPINC (81) Equity from Investments 5 Non-recurring charges (6)…
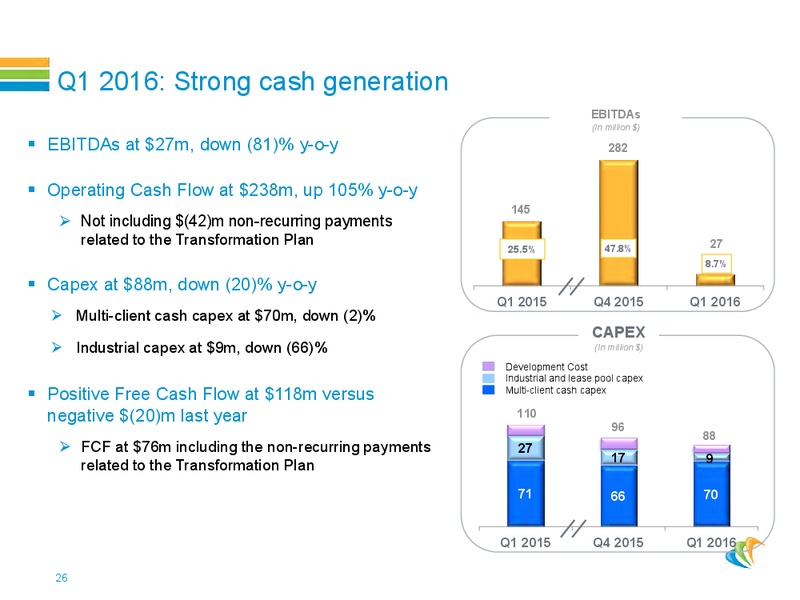
Q1 2016: Strong cash generation EBITDAs (In million ) EBITDAs at 27m, down (81)% y-o-y 282 Operating Cash Flow at 238m, up 105% y-o-y 145 Not including (42)m non-recurring payments related to the Transformation Plan 25.5% 47.8%…
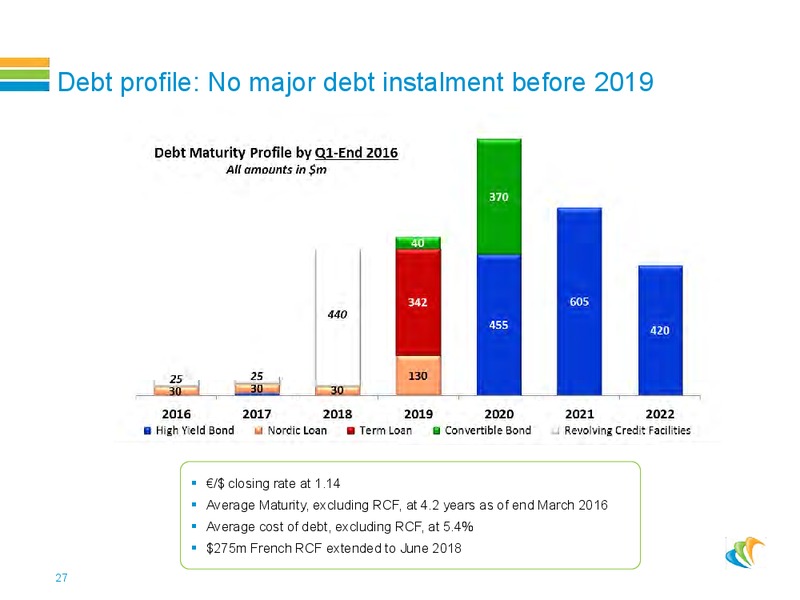
Debt profile: No major debt instalment before 2019 / closing rate at 1.14 Average Maturity, excluding RCF, at 4.2 years as of end March 2016 Average cost of debt, excluding RCF, at 5.4% 275m French RCF extended to June 2018 27
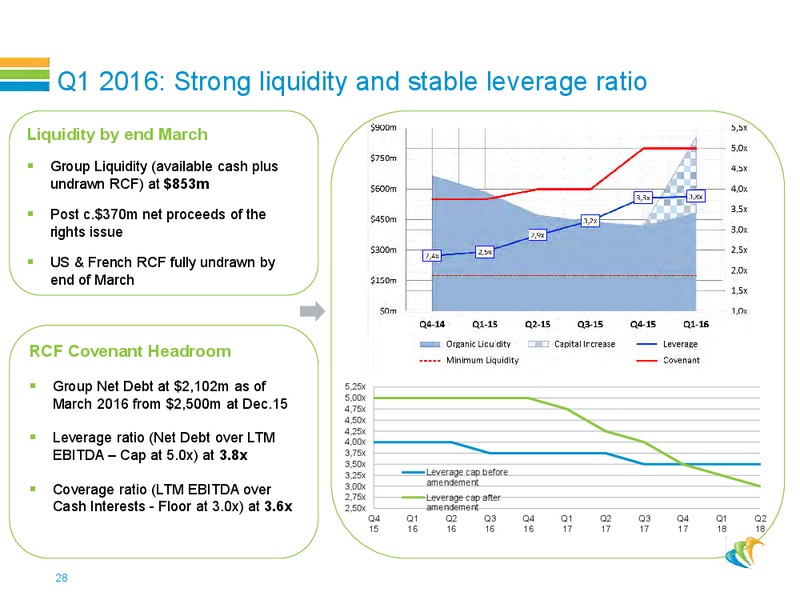
Q1 2016: Strong liquidity and stable leverage ratio Liquidity by end March Group Liquidity (available cash plus undrawn RCF) at 853m Post c.370m net proceeds of the rights issue US & French RCF fully undrawn by end of March…
Conclusion
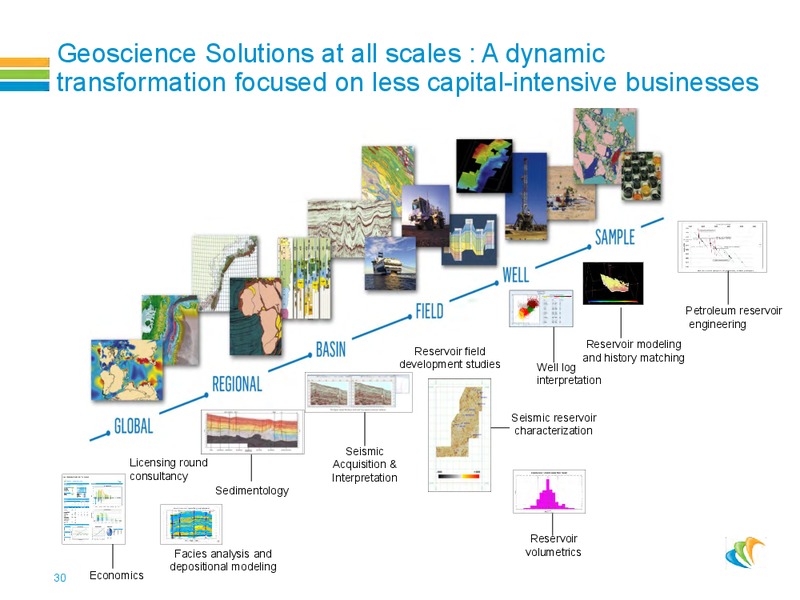
Geoscience Solutions at all scales : A dynamic transformation focused on less capital-intensive businesses Petroleum reservoir engineering Reservoir modeling Reservoir field and history matching development studies Well log…
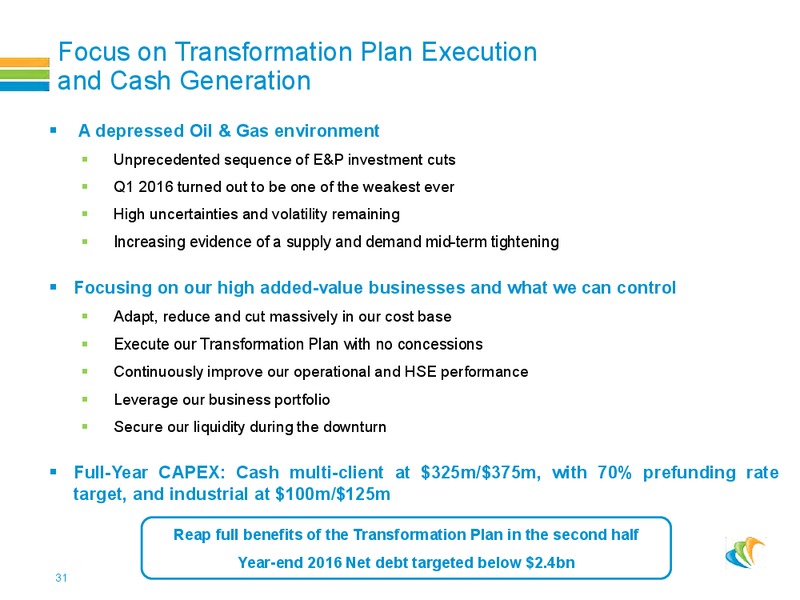
Focus on Transformation Plan Execution and Cash Generation A depressed Oil & Gas environment Unprecedented sequence of E&P investment cuts Q1 2016 turned out to be one of the weakest ever High uncertainties and volatility remaining…
Thank you
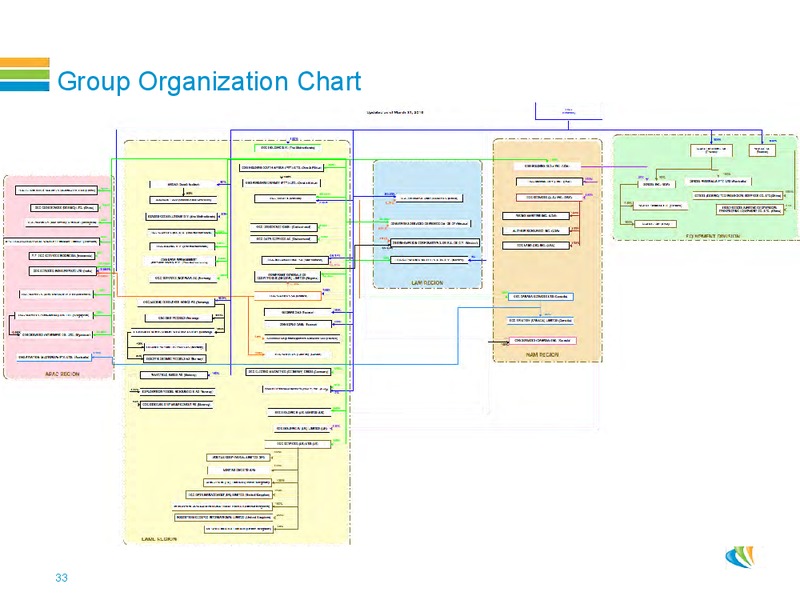
Group Organization Chart 33
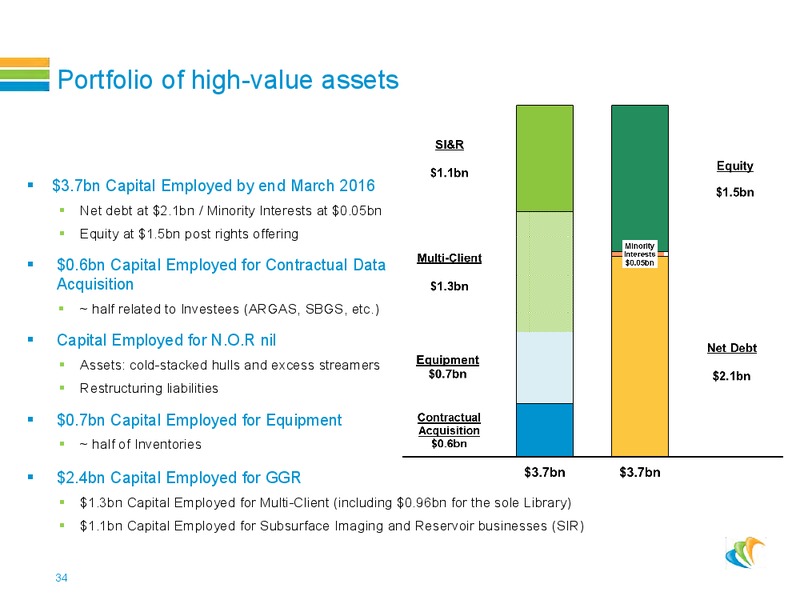
Portfolio of high-value assets 3.7bn Capital Employed by end March 2016 Net debt at 2.1bn / Minority Interests at 0.05bn Equity at 1.5bn post rights offering 0.6bn Capital Employed for Contractual Data Acquisition half related…
Q1 2016 Financial Highlights In a depressed market environment, CGG delivered a weak operating income Revenue at 313m, down 45% y-o-y and Operating Income at (81)m GGR: very low multi-client revenue after strong Q4, margin impacted by…
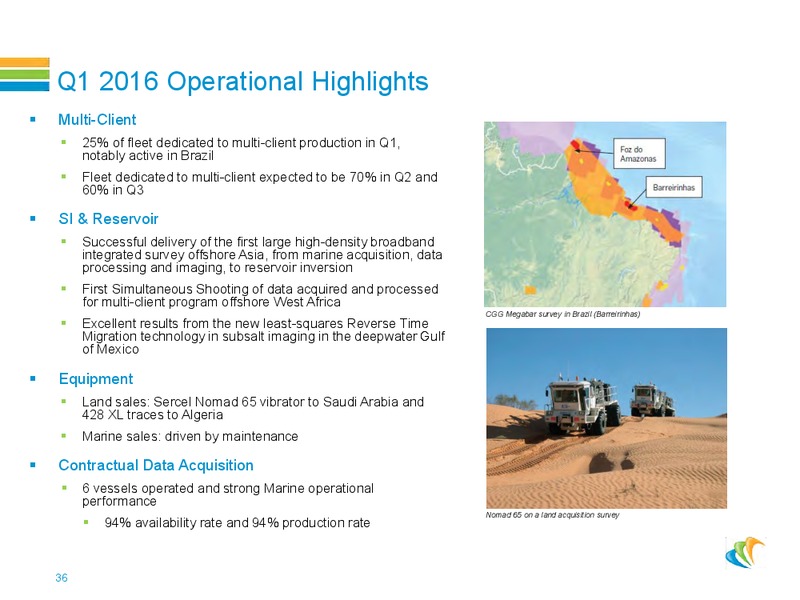
Q1 2016 Operational Highlights Multi-Client 25% of fleet dedicated to multi-client production in Q1, notably active in Brazil Fleet dedicated to multi-client expected to be 70% in Q2 and 60% in Q3 SI & Reservoir Successful…
 Loading...