Skip to main content Q3 2016 Conference Call – Maersk Oil Investor Presentation | Shale Experts
Loading...

Q3 2016 Conference Call – Maersk Oil

Maersk Oil · Nov 2, 2016 · 13 slides

Investor presentation from the Shale Experts oil & gas presentation and slide database. Every page is imaged and its text indexed for search across operators, plays, basins and time.

Slides

  1. Q3 2016 Conference Call – Maersk Oil – slide 1
    Maersk Group Q3 2016 report 2 November 2016 - Conference call 9.30am CET webcast available at www.maersk.com
  2. Q3 2016 Conference Call – Maersk Oil – slide 2
    page 2 Forward-looking Statements This presentation contains forward-looking statements. Such statements are subject to risks and uncertainties as various factors, many of which are beyond A.P. Mller - Mrsk A/S control, may…
  3. Q3 2016 Conference Call – Maersk Oil – slide 3
    page 3 Group financial highlights Group Financial Highlights Group highlights Q3 2016 Group profit decreased 44% to USD 438m (USD 778m) USDm Underlying Q3 2015 Q3 2016 Profit profit* Free cash flow negatively impacted by…
  4. Q3 2016 Conference Call – Maersk Oil – slide 4
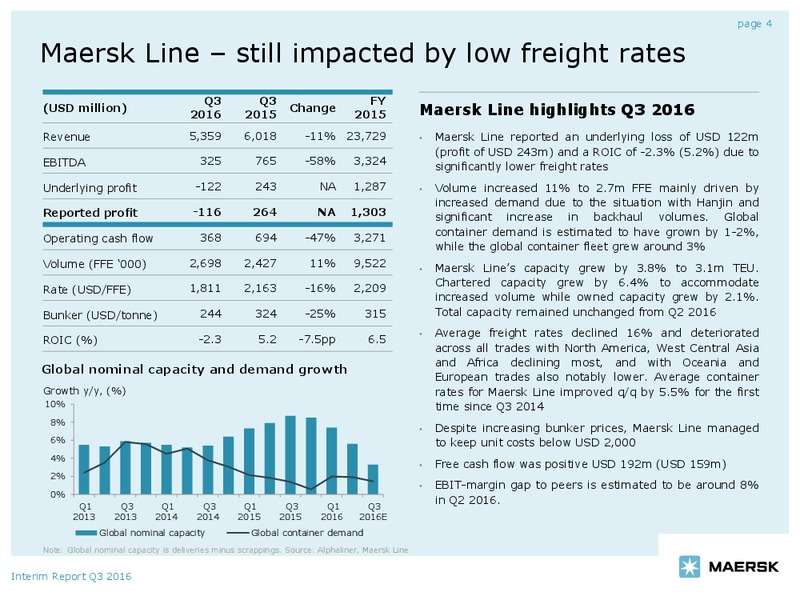
    page 4 Maersk Line still impacted by low freight rates Q3 Q3 FY (USD million) 2016 2015 Change 2015 Maersk Line highlights Q3 2016 Revenue 5,359 6,018 -11% 23,729 Maersk Line reported an underlying loss of USD 122m (profit of…
  5. Q3 2016 Conference Call – Maersk Oil – slide 5
    page 5 Maersk Line unit costs remain below 2,000 USD/FFE Unit cost including VSA income Maersk Line highlights Q3 2016 USD/FFE 3,200 3,097 3,092 Cost leadership remains a key strategic priority for 3,010 3,000 3,012 2,871…
  6. Q3 2016 Conference Call – Maersk Oil – slide 6
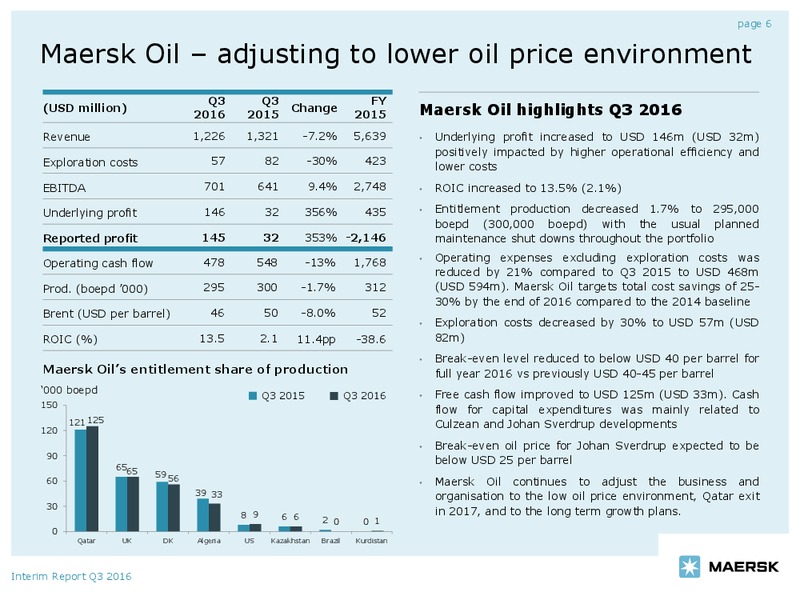
    page 6 Maersk Oil adjusting to lower oil price environment Q3 Q3 FY (USD million) 2016 2015 Change 2015 Maersk Oil highlights Q3 2016 Revenue 1,226 1,321 -7.2% 5,639 Underlying profit increased to USD 146m (USD 32m) positively…
  7. Q3 2016 Conference Call – Maersk Oil – slide 7
    page 7 APM Terminals increasing volumes Q3 Q3 FY (USD million) 2016 2015 Change 2015 APM Terminals highlights Q3 2016 Revenue 1,062 1,046 1.5% 4,240 APM Terminals delivered an underlying profit of EBITDA 199 220 -9.5% 845 USD…
  8. Q3 2016 Conference Call – Maersk Oil – slide 8
    page 8 Maersk Drilling continuing to take out cost Q3 Q3 FY (USD million) 2016 2015 Change 2015 Maersk Drilling highlights Q3 2016 Revenue 733 646 13% 2,517 Maersk Drilling reported an underlying profit of USD EBITDA 501 369…
  9. Q3 2016 Conference Call – Maersk Oil – slide 9
    page 9 APM Shipping Services weakening market conditions Q3 Q3 FY (USD million) 2016 2015 Change 2015 APM Shipping Services highlights Q3 Revenue 1,091 1,307 -17% 5,080 APM Shipping Services reported an underlying profit of…
  10. Q3 2016 Conference Call – Maersk Oil – slide 10
    page 10 Stable operating cash flow generation Historically stable operating cash flow* Historically solid cash conversion Generating a stable operating cash flow over time Solid conversion of EBITDA to operating cash flow USDbn…
  11. Q3 2016 Conference Call – Maersk Oil – slide 11
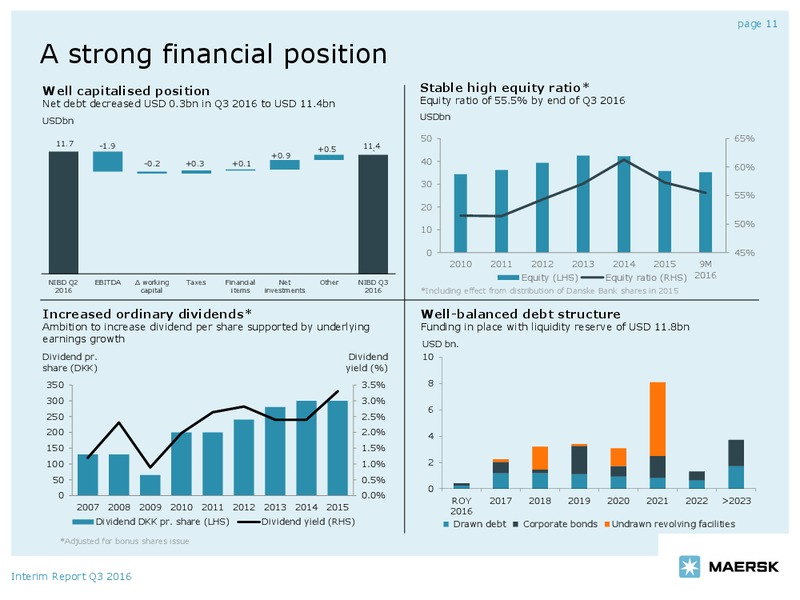
    page 11 A strong financial position Well capitalised position Stable high equity ratio* Net debt decreased USD 0.3bn in Q3 2016 to USD 11.4bn Equity ratio of 55.5% by end of Q3 2016 USDbn USDbn 50 65% 11.7 -1.9 11.4 +0.5 +0.9…
  12. Q3 2016 Conference Call – Maersk Oil – slide 12
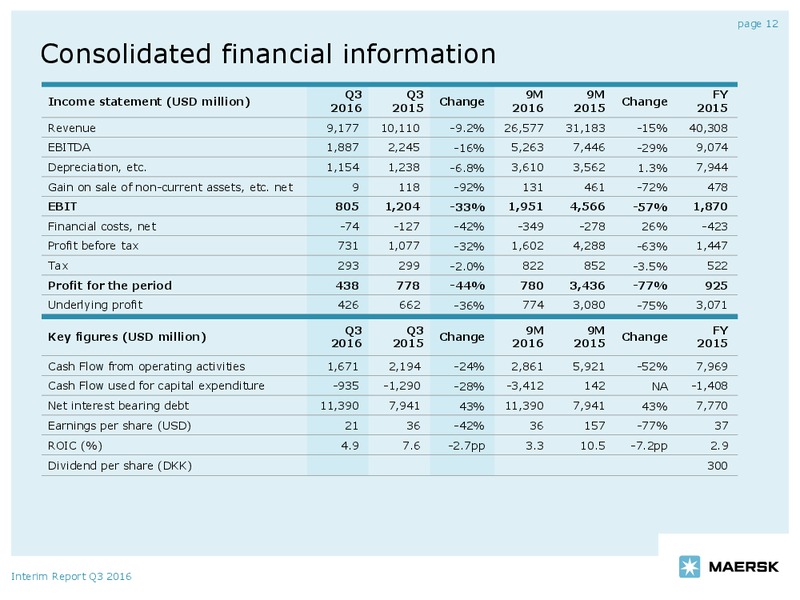
    page 12 Consolidated financial information Q3 Q3 9M 9M FY Income statement (USD million) Change Change 2016 2015 2016 2015 2015 Revenue 9,177 10,110 -9.2% 26,577 31,183 -15% 40,308 EBITDA 1,887 2,245 -16% 5,263 7,446 -29% 9,074…
  13. Q3 2016 Conference Call – Maersk Oil – slide 13
    page 13 Guidance for 2016 Changes in guidance are versus guidance given at Q2 2016. Maersk Drilling now expects an underlying result in line All figures in parenthesis refer to full year 2015. with last year (USD 732m), with a…

From the store

Browse maps, data & reports in the Shale Experts store