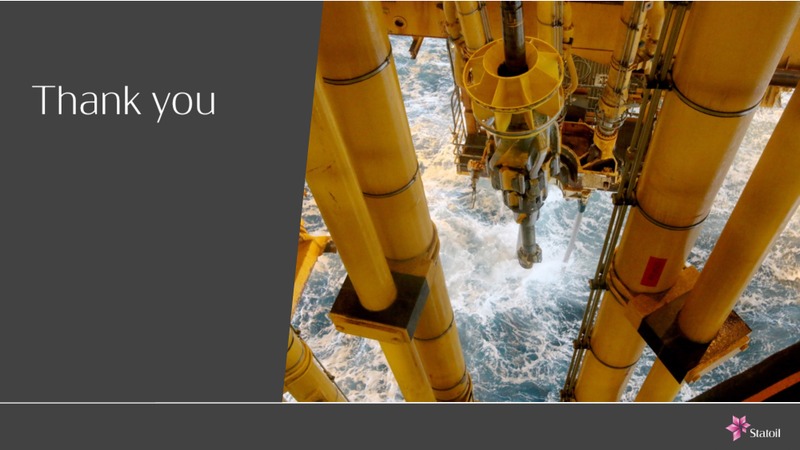
1st Quarter 2016 Eldar Stre, President and CEO Photo: Drilling at Johan Sverdrup field
First quarter 2016 Financial results affected by low price environment Strong operational performance Continue to capture cost reductions and efficiency gains Maintaining dividend of USD 0.2201 per share, with 5% discounted scrip…
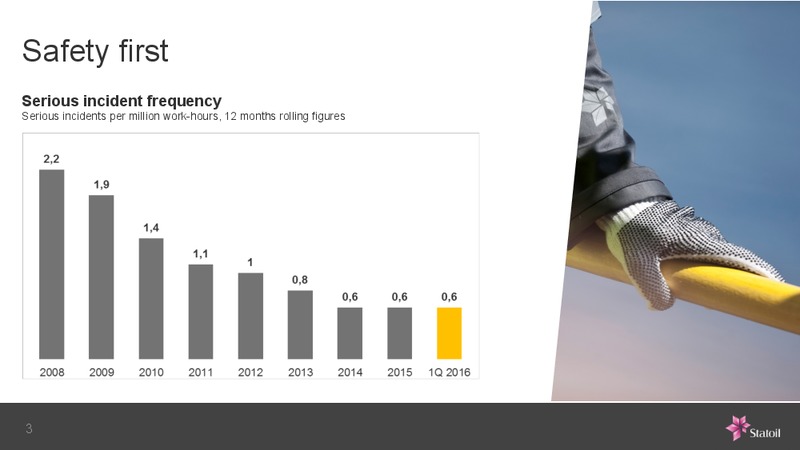
Safety first Serious incident frequency Serious incidents per million work-hours, 12 months rolling figures 3
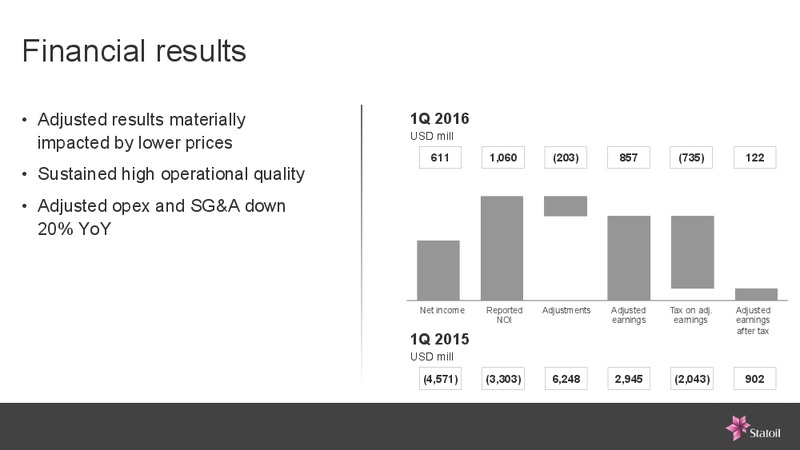
Financial results Adjusted results materially 1Q 2016 USD mill impacted by lower prices 611 1,060 (203) 857 (735) 122 Sustained high operational quality Adjusted opex and SG&A down 20% YoY Net income Reported Adjustments…
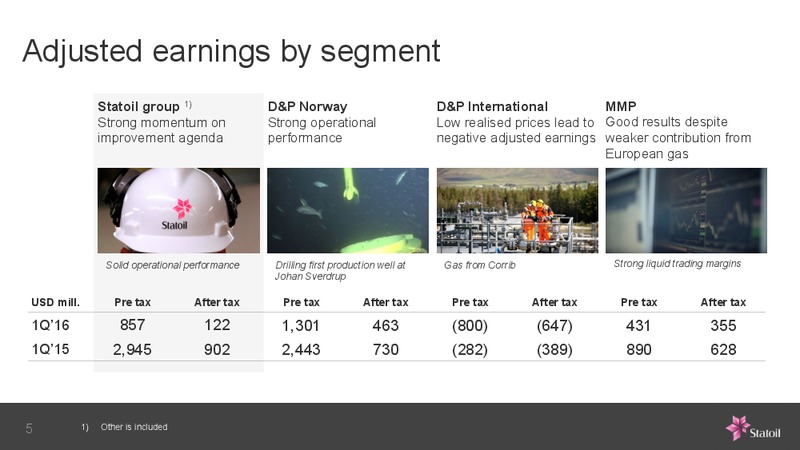
Adjusted earnings by segment Statoil group 1) D&P Norway D&P International MMP Strong momentum on Strong operational Low realised prices lead to Good results despite improvement agenda performance negative adjusted earnings weaker…
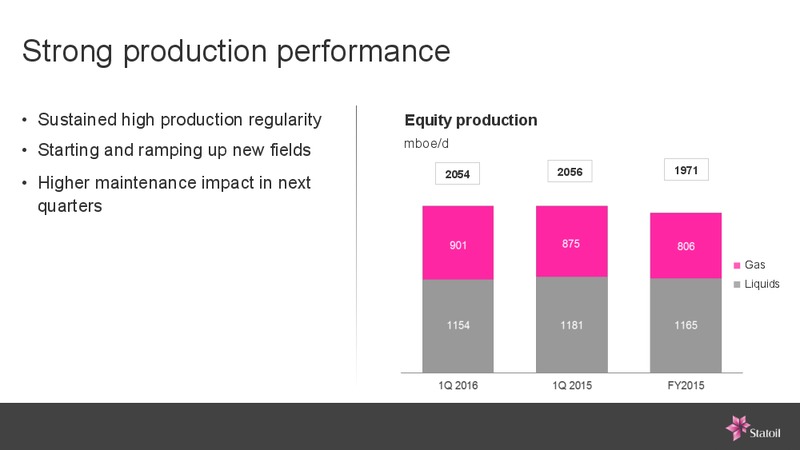
Strong production performance Sustained high production regularity Equity production mboe/d Starting and ramping up new fields 2054 2056 1971 Higher maintenance impact in next quarters Gas Liquids
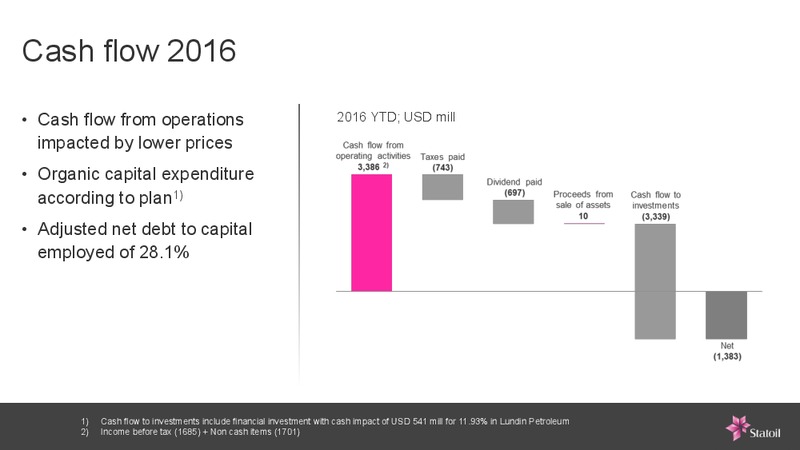
Cash flow 2016 Cash flow from operations 2016 YTD; USD mill impacted by lower prices Organic capital expenditure according to plan1) Adjusted net debt to capital employed of 28.1% 1) Cash flow to investments include financial…
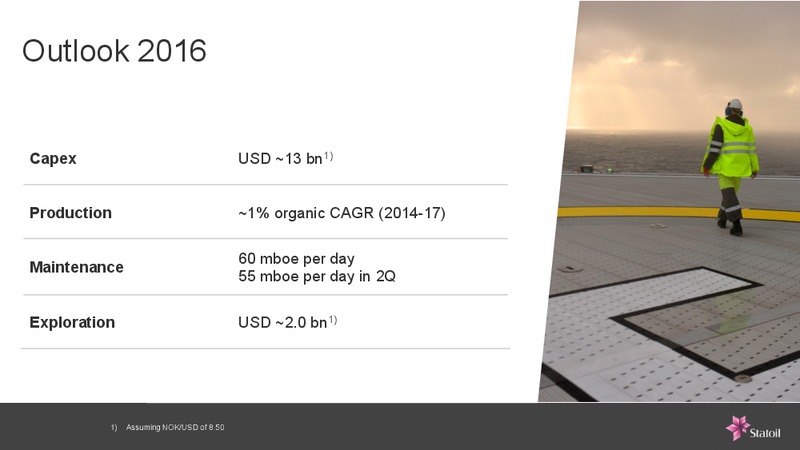
Outlook 2016 Capex USD 13 bn1) Production 1% organic CAGR (2014-17) 60 mboe per day Maintenance 55 mboe per day in 2Q Exploration USD 2.0 bn1) 1) Assuming NOK/USD of 8.50
 Loading...