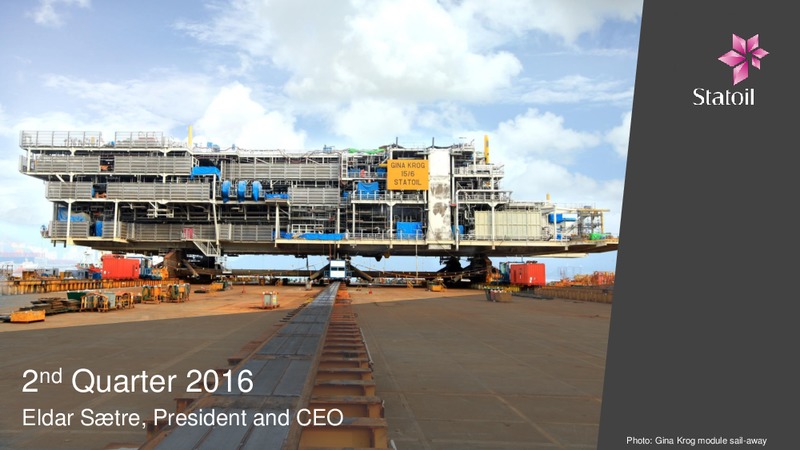
2nd Quarter 2016 Eldar Stre, President and CEO Photo: Gina Krog module sail-away
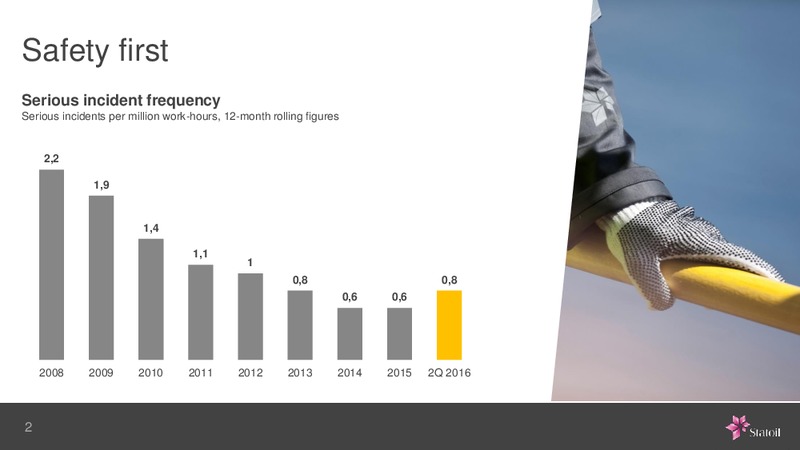
Safety first Serious incident frequency Serious incidents per million work-hours, 12-month rolling figures 2,2 1,9 1,4 1,1 1 0,8 0,8 0,6 0,6 2008 2009 2010 2011 2012 2013 2014 2015 2Q 2016 2
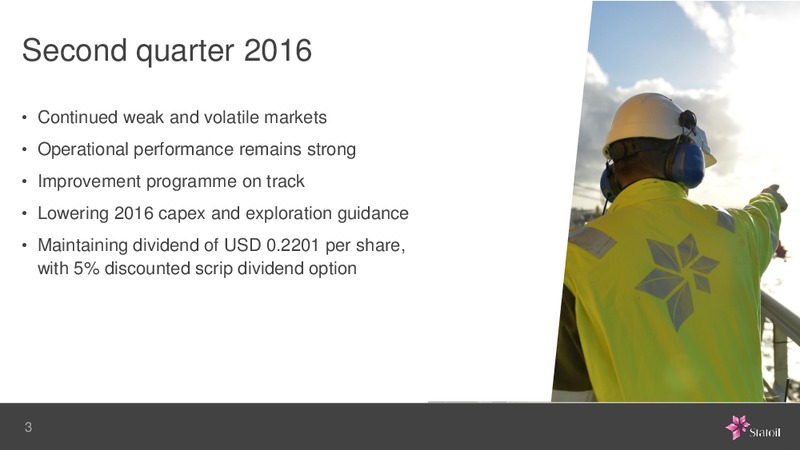
Second quarter 2016 Continued weak and volatile markets Operational performance remains strong Improvement programme on track Lowering 2016 capex and exploration guidance Maintaining dividend of USD 0.2201 per share, with 5%…
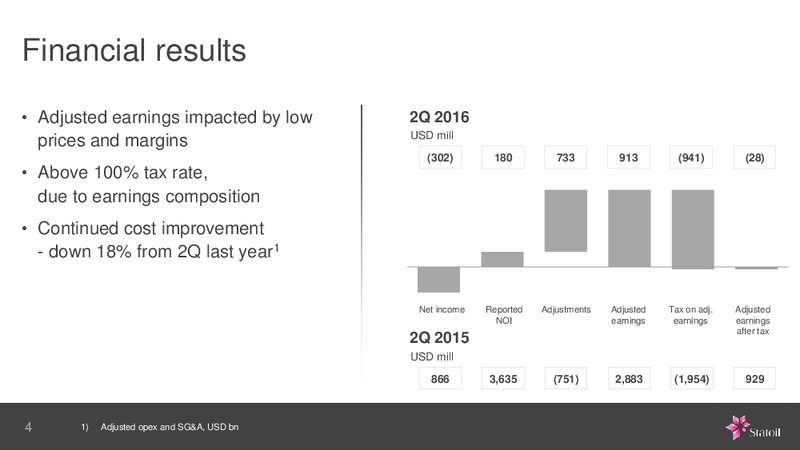
Financial results Adjusted earnings impacted by low 2Q 2016 USD mill prices and margins (302) 180 733 913 (941) (28) Above 100% tax rate, due to earnings composition Continued cost improvement - down 18% from 2Q last year1 Net…
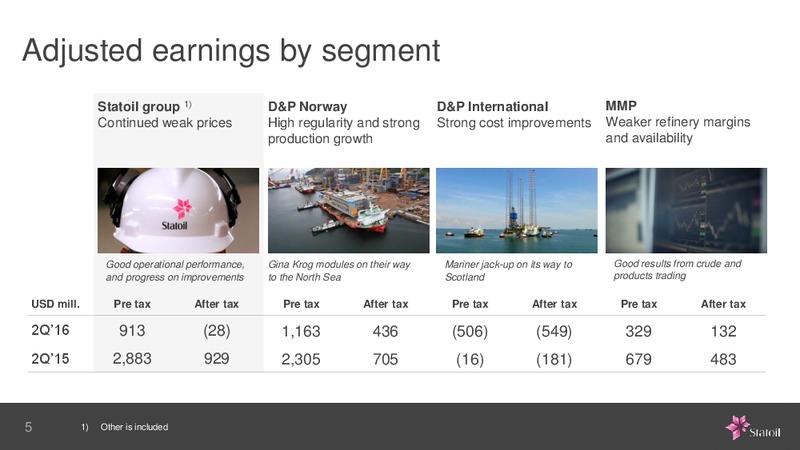
Adjusted earnings by segment Statoil group 1) D&P Norway D&P International MMP Continued weak prices High regularity and strong Strong cost improvements Weaker refinery margins production growth and availability Good operational…
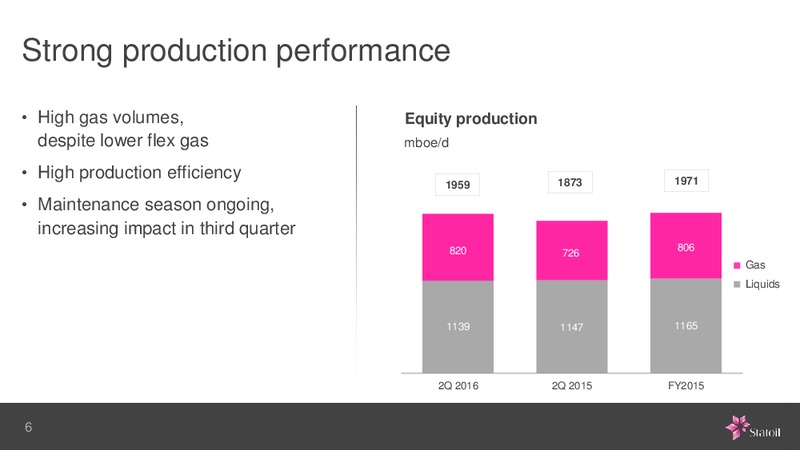
Strong production performance High gas volumes, Equity production despite lower flex gas mboe/d High production efficiency 1873 1971 1959 Maintenance season ongoing, increasing impact in third quarter 820 806 726 Gas Liquids…
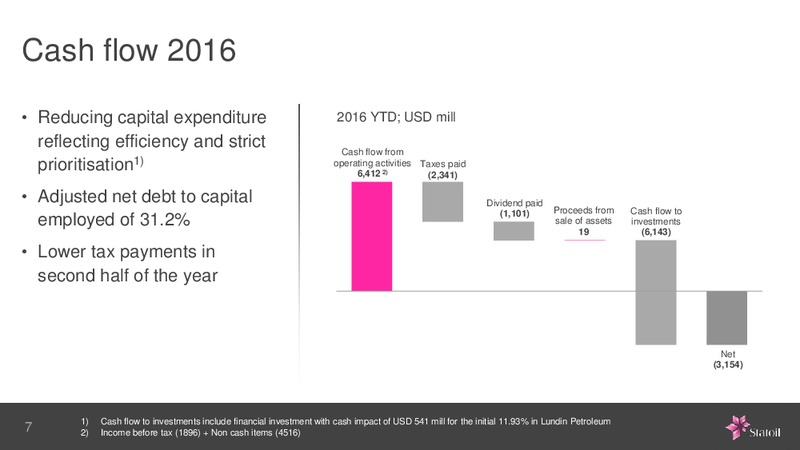
Cash flow 2016 Reducing capital expenditure 2016 YTD; USD mill reflecting efficiency and strict Cash flow from prioritisation1) operating activities Taxes paid 6,412 2) (2,341) Adjusted net debt to capital Dividend paid (1,101)…
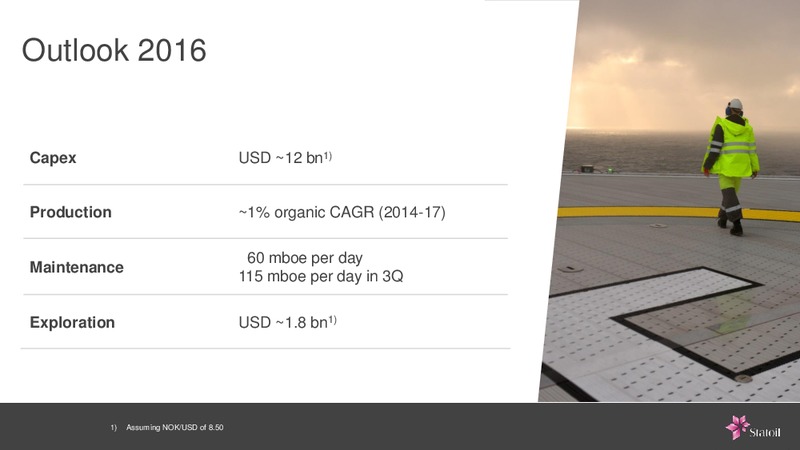
Outlook 2016 Capex USD 12 bn1) Production 1% organic CAGR (2014-17) 60 mboe per day Maintenance 115 mboe per day in 3Q Exploration USD 1.8 bn1) 1) Assuming NOK/USD of 8.50
 Loading...