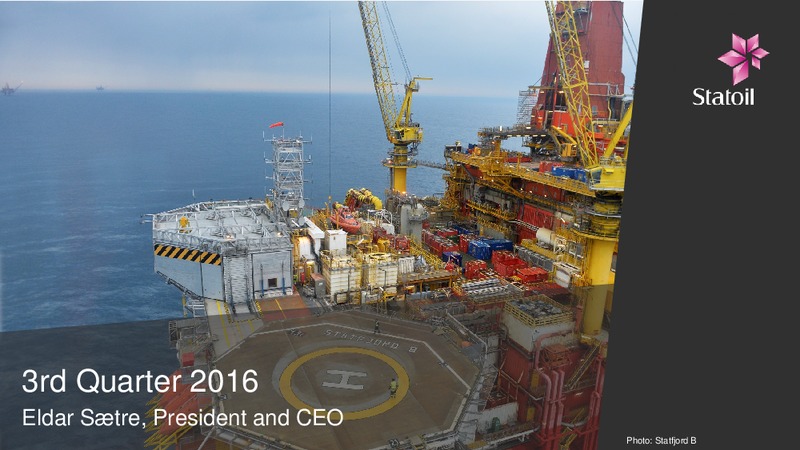
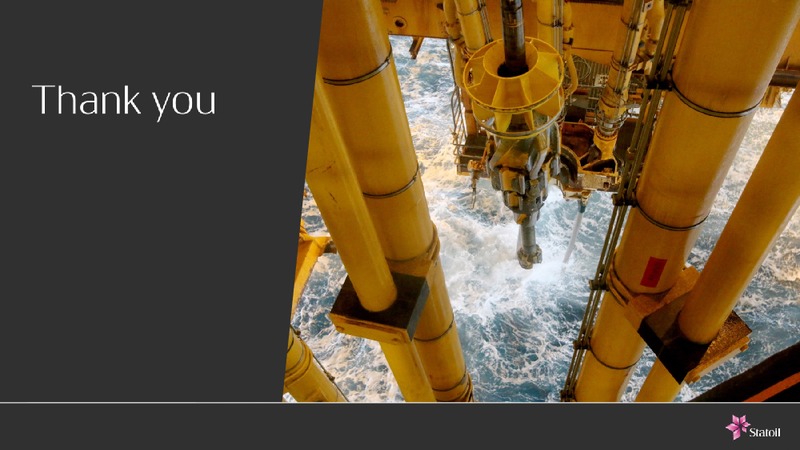
3rd Quarter 2016 Eldar Stre, President and CEO Photo: Statfjord B
Third quarter 2016 Results impacted by continued weak markets, extensive planned turnarounds, and expensed exploration wells Strong operational performance and improvement programme on track Solid cash flow and reduced net debt…
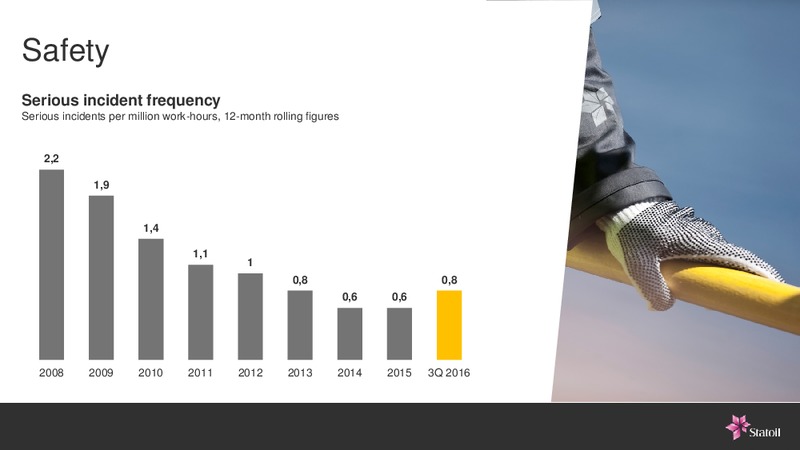
Safety Serious incident frequency Serious incidents per million work-hours, 12-month rolling figures 2,2 1,9 1,4 1,1 1 0,8 0,8 0,6 0,6 2008 2009 2010 2011 2012 2013 2014 2015 3Q 2016
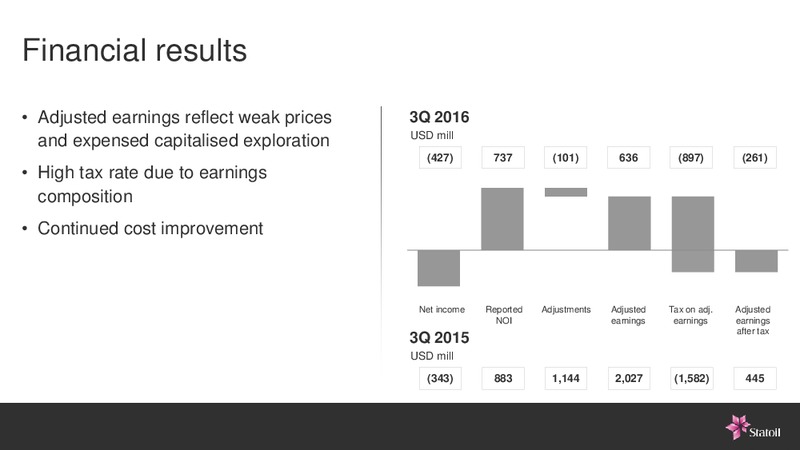
Financial results Adjusted earnings reflect weak prices 3Q 2016 USD mill and expensed capitalised exploration (427) 737 (101) 636 (897) (261) High tax rate due to earnings composition Continued cost improvement Net income…
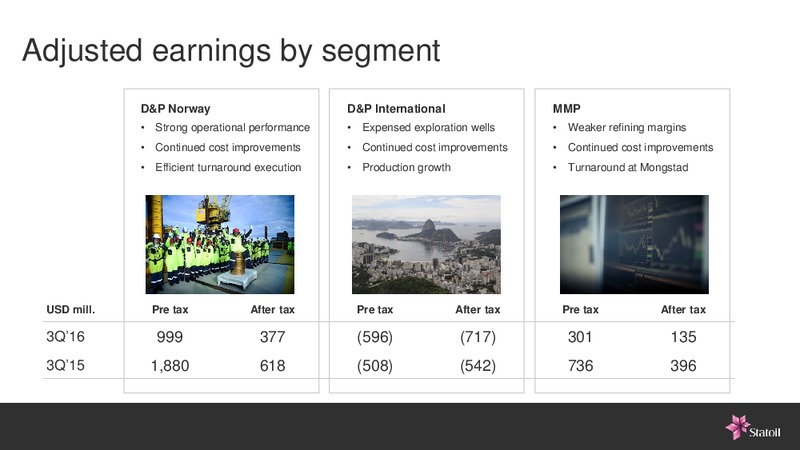
Adjusted earnings by segment D&P Norway D&P International MMP Strong operational performance Expensed exploration wells Weaker refining margins Continued cost improvements Continued cost improvements Continued cost improvements…
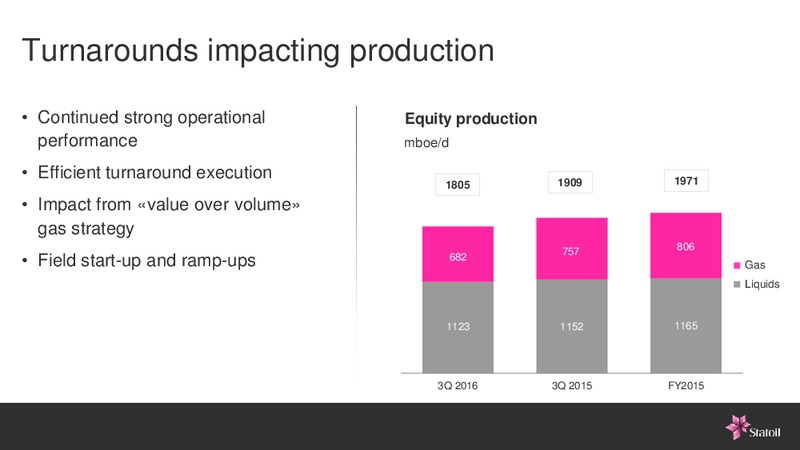
Turnarounds impacting production Continued strong operational Equity production performance mboe/d Efficient turnaround execution 1909 1971 1805 Impact from value over volume gas strategy 757 806 Field start-up and ramp-ups 682…
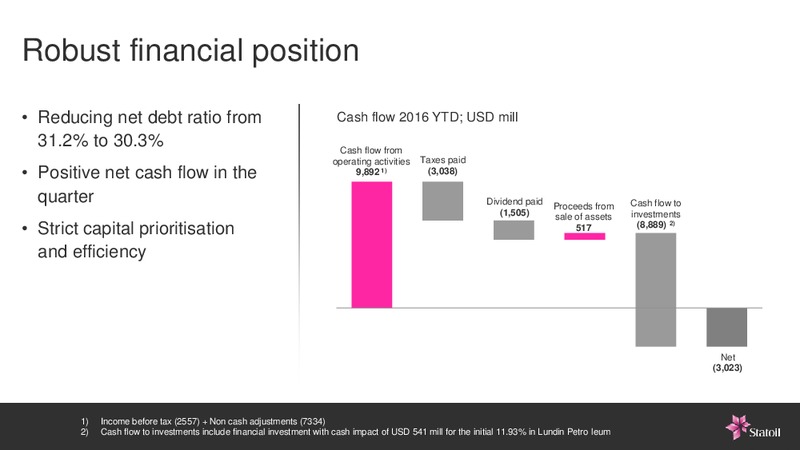
Robust financial position Reducing net debt ratio from Cash flow 2016 YTD; USD mill 31.2% to 30.3% Cash flow from operating activities Taxes paid Positive net cash flow in the 9,892 1) (3,038) quarter Dividend paid Proceeds from…
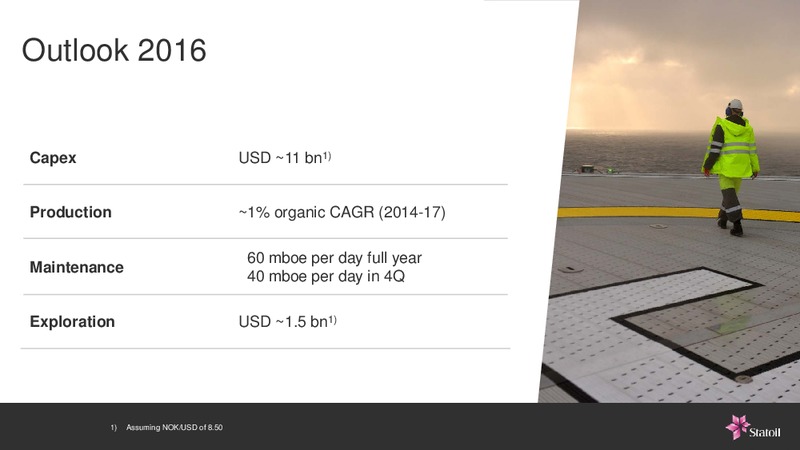
Outlook 2016 Capex USD 11 bn1) Production 1% organic CAGR (2014-17) 60 mboe per day full year Maintenance 40 mboe per day in 4Q Exploration USD 1.5 bn1) 1) Assuming NOK/USD of 8.50
Forward-looking statements This report contains certain forward-looking statements that involve risks and uncertainties. In some cases, adverse changes in tax regimes; the development and use of new technology; geological or technical we…
 Loading...