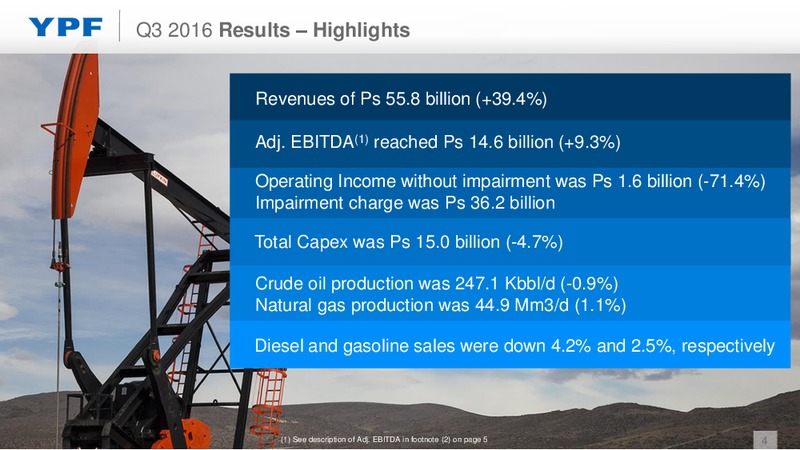
Q3 2016 Results Highlights Revenues of Ps 55.8 billion (+39.4%) Adj. EBITDA(1) reached Ps 14.6 billion (+9.3%) Operating Income without impairment was Ps 1.6 billion (-71.4%) Impairment charge was Ps 36.2 billion Total Capex was…
Q3 2016 Results Expressed in US Dollars The devaluation of the local currency resulted in an immediate reduction of Revenues, Adj. EBITDA and Operating Income, which was also affected by higher DD&A. Revenues (1) Adj. EBITDA (1) (2)…
Q3 2016 Operating Income Operating Income before impairment charge was down 71.4%. (in millions of Ps) 5,631 -2,404 1,610 -1,120 -497 (1) Q3 2015 Downstream Upstream Corporate & Other Q3 2016 (1) Operating Income…
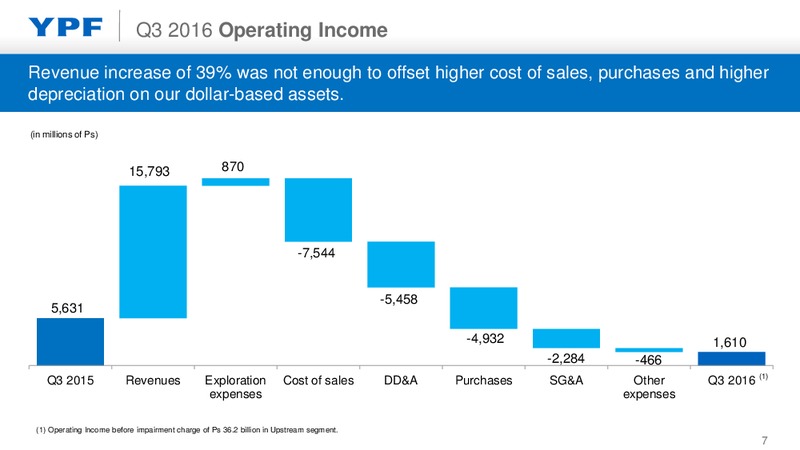
Q3 2016 Operating Income Revenue increase of 39% was not enough to offset higher cost of sales, purchases and higher depreciation on our dollar-based assets. (in millions of Ps) 15,793 870 -7,544 -5,458 5,631 -4,932…
Q3 2016 Upstream Results Upstream Operating Income before impairment charge was down 51.6% mainly due to higher increases in cash costs (other than lifting cost) and DD&A vis a vis increase in prices in pesos. (In million of Ps) 741…
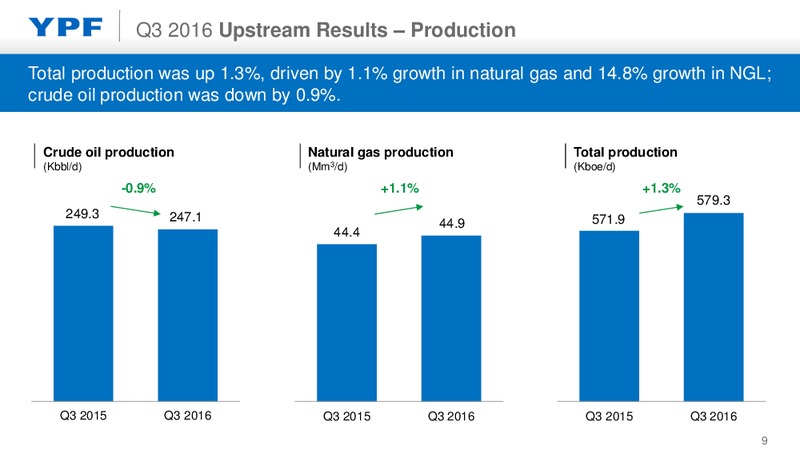
Q3 2016 Upstream Results Production Total production was up 1.3%, driven by 1.1% growth in natural gas and 14.8% growth in NGL; crude oil production was down by 0.9%. Crude oil production Natural gas production Total production…
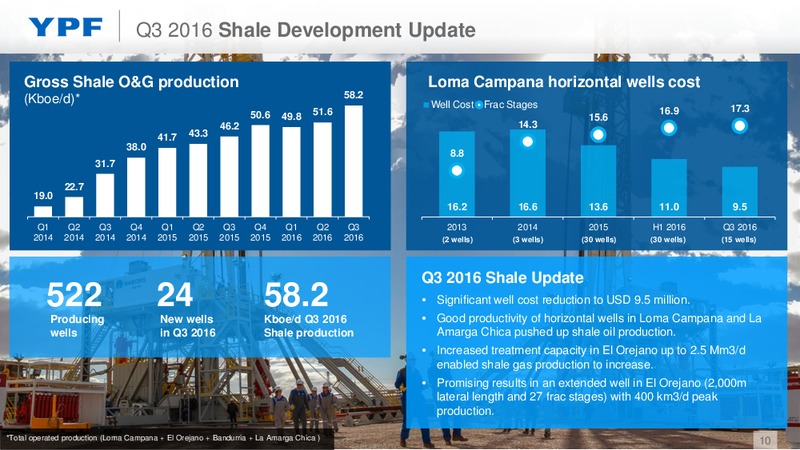
Q3 2016 Shale Development Update Gross Shale O&G production Loma Campana horizontal wells cost (Kboe/d)* 58.2 Well Cost Frac Stages 17.3 50.6 51.6 16.9 49.8 15.6 46.2 14.3 41.7 43.3 38.0 8.8 31.7 22.7 19.0 16.2 16.6 13.6…
Q3 2016 Vaca Muerta - recent agreement with Neuqun Extension of pilot programs in core areas, 11 contracts with Gas y Petrleo de Neuqun La Amarga Chica and Bajada de Aelo (GyP) on core areas maturing within 2016 and until December 2019…
Q3 2016 Tight Gas Production Tight gas production Tight Gas Gross Production - Mm3/d 11.7 11.0 represented 21% of total natural gas production TG EFO Lajas TG RdM Mulichinco 9.0 in Q3 2016. TG ATSB Lajas 8.4 7.9 8.1 7.3 6.7 6.9…
Q3 2016 Downstream Results Downstream Operating Income declined 68.3% as revenue increase was below the increase in purchases; volumes sold were below expectations. (in millions of Ps) 14,711 3,522 -13,231 -1,670 1,118…
Q3 2016 Downstream Results - Sales Refinery output affected by maintenance activity in our Lujn de Cuyo refinery; sales volumes were down by 1.1% due to lower diesel and gasoline demand. Crude processed Domestic sales of refined…
Q3 2016 Downstream Results Demand Gasoline and diesel sales were down by 2.5% and 4.2%, respectively; slight reduction in market share. Monthly Gasoline Sales (Km3) Monthly Diesel Sales (Km3) 480 - 2.5% 800 + -4.2% 0.8% 460…
Q3 2016 Capex Capex was down 41.1% in USD terms and 4.7% in pesos, mostly due to reduced activity in the Upstream segment. Upstream Downstream (in millions of Ps) Upstream Activity breakdown: 69% in drilling Others and workovers,…
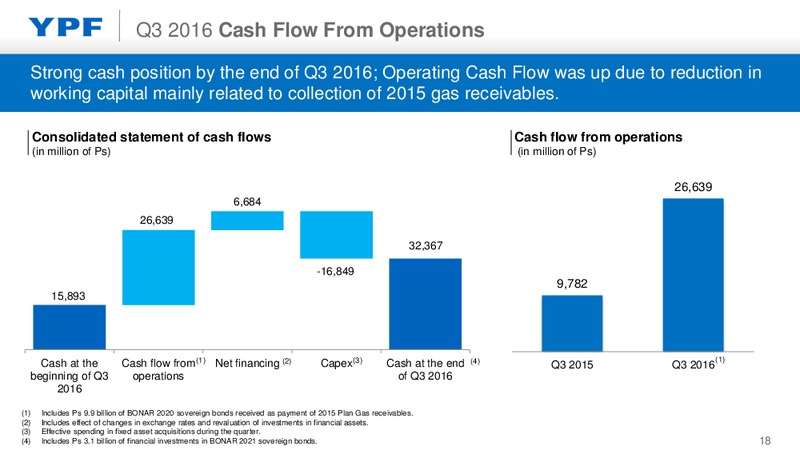
Q3 2016 Cash Flow From Operations Strong cash position by the end of Q3 2016; Operating Cash Flow was up due to reduction in working capital mainly related to collection of 2015 gas receivables. Consolidated statement of cash flows…
Q3 2016 Financial Situation Update(1) Cash position strengthened by new debt issuance and unusual strong cash flow generation in the quarter. Financial debt amortization schedule (1) (2) (in millions of USD) Debt profile…
Q3 2016 Summary Maintained production in line with previous year and budget, despite reduction in capex Lifting cost reduction in dollars; labor productivity discussions under way Improve operating cash flow by reduction in…
 Loading...