Shell Midstream Partners, L.P. (SHLX) Q3 2016 Results November 3, 2016 John Hollowell Chief Executive Officer Shell Midstream Partners November 2016 1
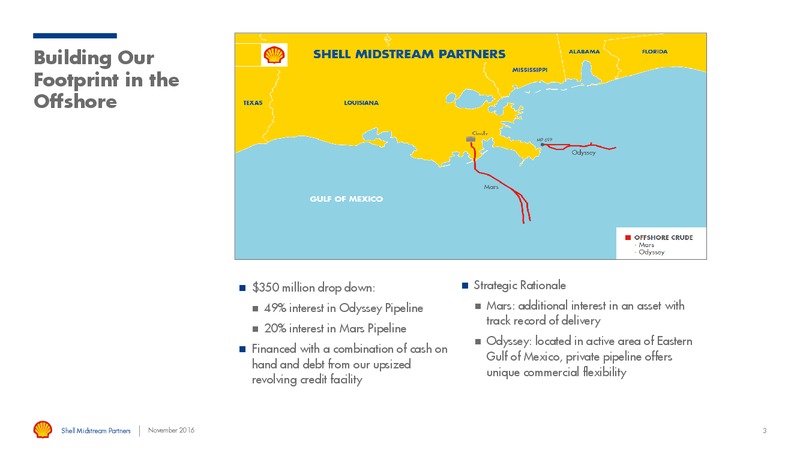
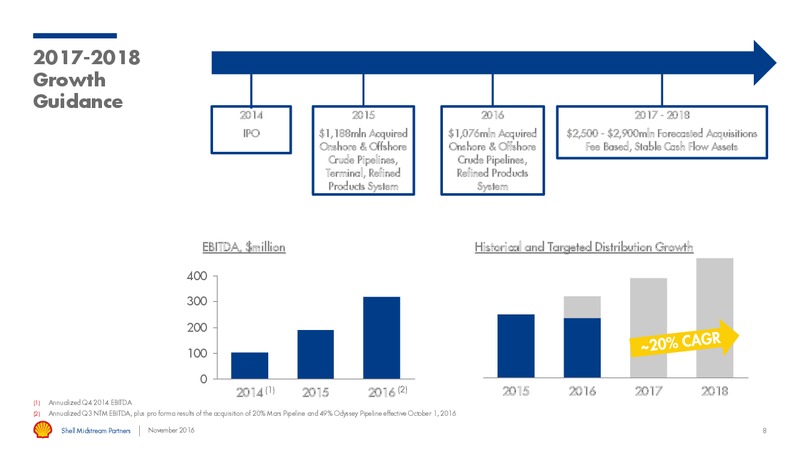
Building Our Footprint in the Offshore 350 million drop down: Strategic Rationale 49% interest in Odyssey Pipeline Mars: additional interest in an asset with track record of delivery 20% interest in Mars Pipeline Odyssey:…
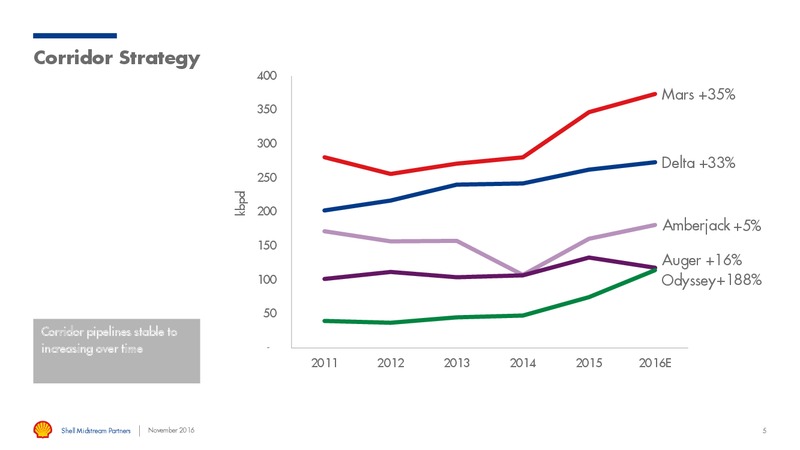
Corridor Strategy 400 Mars +35% 350 300 Delta +33% 250 kbpd 200 Amberjack +5% 150 Auger +16% 100 Odyssey +188% 50 Corridor pipelines stable to increasing over time - 2011 2012 2013 2014 2015 2016E Shell Midstream…
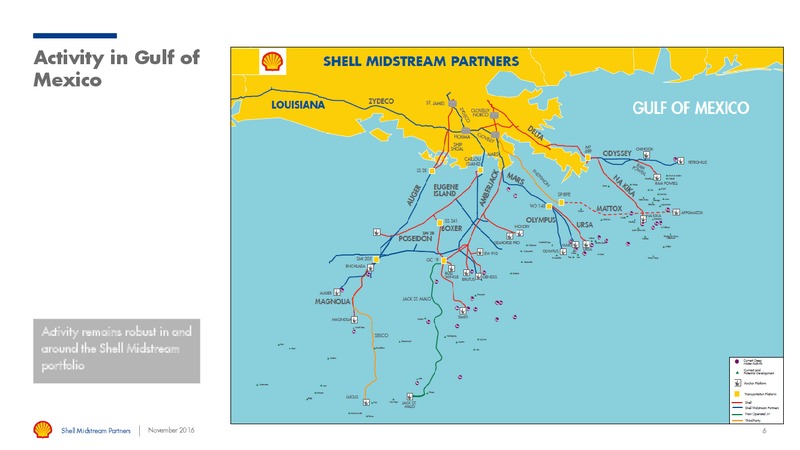
Activity in Gulf of Mexico Activity remains robust in and around the Shell Midstream portfolio Shell Midstream Partners November 2016 6
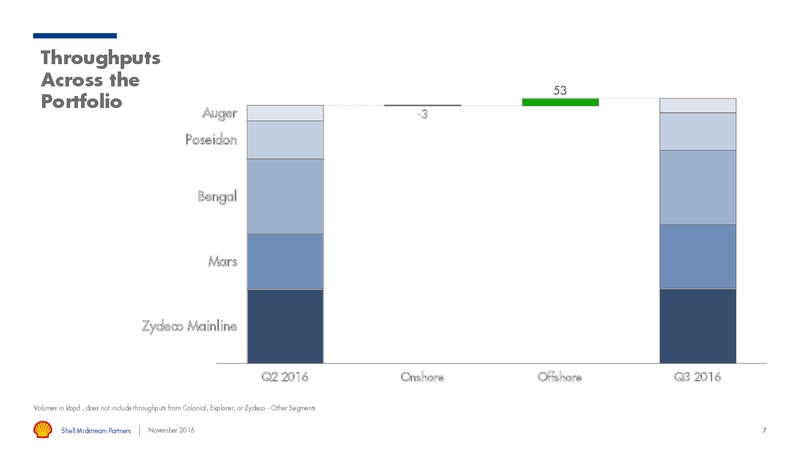
Throughputs Across the 53 Portfolio Auger -3 Poseidon Bengal Mars Zydeco Mainline Q2 2016 Onshore Offshore Q3 2016 Volumes in kbpd , does not include throughputs from Colonial, Explorer, or Zydeco - Other Segments…
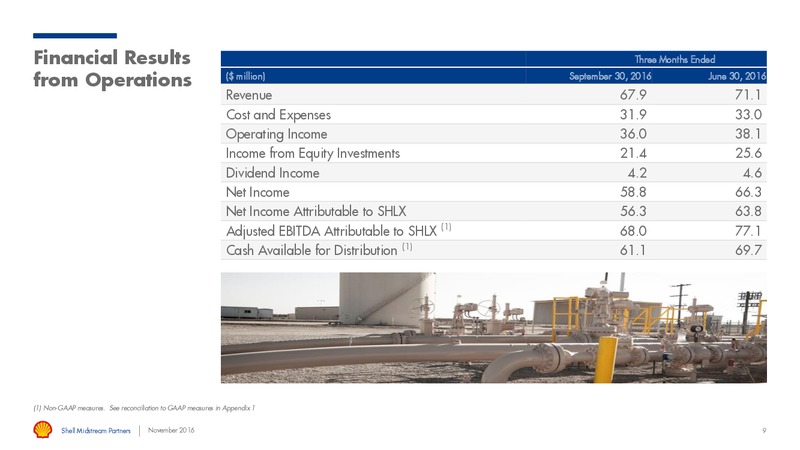
Financial Results Three Months Ended from Operations ( million) September 30, 2016 June 30, 2016 Revenue 67.9 71.1 Cost and Expenses 31.9 33.0 Operating Income 36.0 38.1 Income from Equity Investments 21.4 25.6 Dividend Income 4.2…
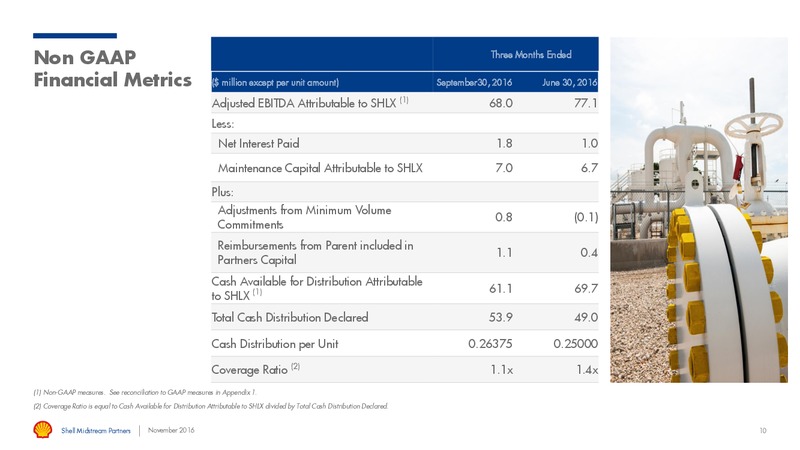
Non GAAP Three Months Ended Financial Metrics ( million except per unit amount) September30, 2016 June 30, 2016 Adjusted EBITDA Attributable to SHLX (1) 68.0 77.1 Less: Net Interest Paid 1.8 1.0 Maintenance Capital Attributable to…
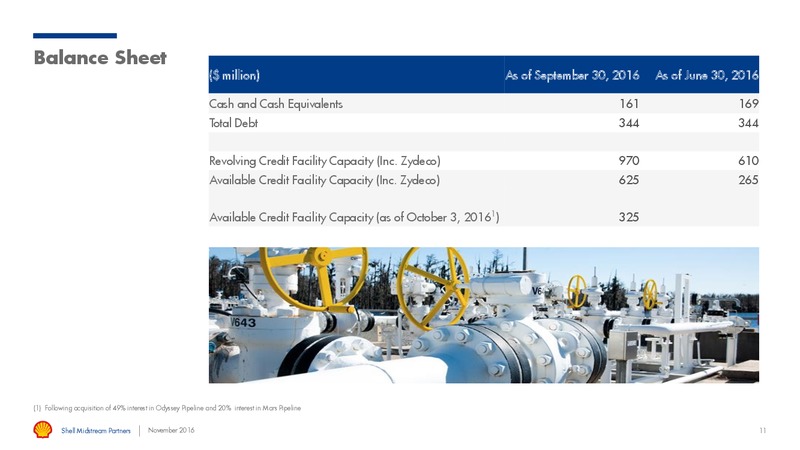
Balance Sheet ( million) As of September 30, 2016 As of June 30, 2016 Cash and Cash Equivalents 161 169 Total Debt 344 344 Revolving Credit Facility Capacity (Inc. Zydeco) 970 610 Available Credit Facility Capacity (Inc. Zydeco)…
Questions and Answers For further questions, please contact Courtney Selinidis +1 713 241 1513 Courtney.SelinidisShell.com Shell Midstream Partners 12
 Loading...