Emerge Energy Services LP Investor Presentation January 2016 www.emergelp.com PAGE 1
Competitive Strengths High Quality, Stable Strategically Cash Flow Located Assets Significant Intrinsic Organic Logistics Growth Advantages Capacity Strong Reputation w/ Low Cost Customers and Operating…
Strengthening the Partnership Formed by the sand and fuel segments, the Emerge Energy Services partnership provides significant EBITDA scale and balance, while also enhancing diversification benefits as the market evolves. Sand…
Strong Track Record of Growth Over the past three years, EMES has grown sand and fuel volumes at a substantial rate; consequently, total adjusted EBITDA has increased by a 142% CAGR from 2011 to 2014. Volume Growth: 2011 - 2014…
3Q15 Summary Performance The energy market downturn continued to apply pressure to the frac sand market during the third quarter. Additionally, the volatility in wholesale fuel prices and weaker volumes contributed to a loss in the…
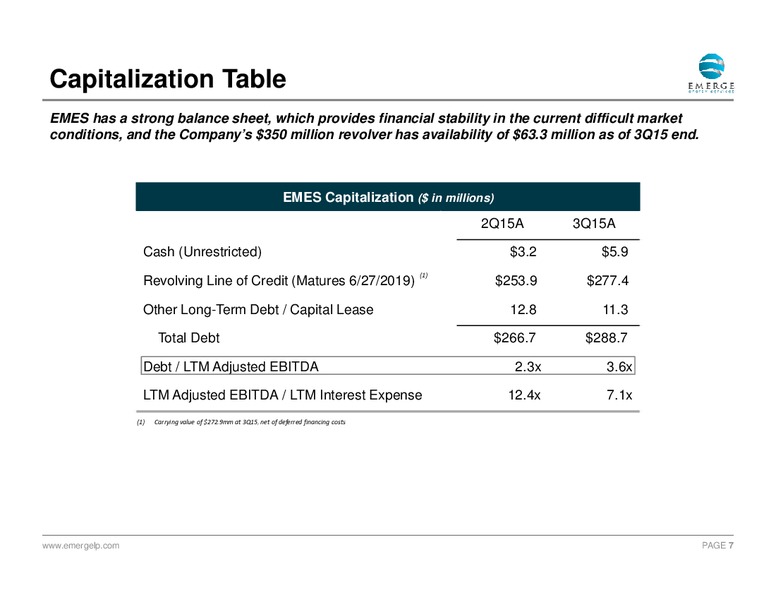
Capitalization Table EMES has a strong balance sheet, which provides financial stability in the current difficult market conditions, and the Companys 350 million revolver has availability of 63.3 million as of 3Q15 end. EMES…
Favorable MLP Structure Strong Distributions per Unit Growth 1.50 1.38 1.41 1.25 1.13 1.17 1.00 1.00 1.00 0.86 (1) 0.70 0.67 0.75 0.50 0.25 0.00 (1) Fullquarter results based on 2Q 2013 3Q 2013 4Q 2013 1Q 2014 2Q 2014…
Expanding Strong Logistics Platform Our Wisconsin sand facilities have direct access on four Class One rail lines and can reach all major shale plays in North America on single-line hauls. Logistics Highlights Wide Geographic…
Weathering the Cycle - Downturns Comparison The current precipitous rig count decline is one of the most severe of the recent downturns as measured by decrease from peak to trough. After a brief stabilization in early summer 2015, rig…
Focusing on Basins with Strong Economics The sand segment sells product into oil and gas basins that have strong economics, even with the sharp decline in commodity prices over the past six months. WTI Oil Breakeven Price ( per Bbl)…
Driving Proppant Usage While overall sand consumption is declining as well count decreases, the amount of sand per well continues to increase, setting the stage for a strong recovery. The drilled but uncompleted wells backlog remains…
Improving Market Share The downturn in the energy market is favoring the large sand providers as customers are demanding competitive prices with complete logistics solutions. Taking the Lead Solid Long-Term Sales Customers are…
Significant Capital Invested & Underutilized Assets The company has invested a significant amount of capital in its sand facilities. With moderate utilization in the current market, the sand segment has a tremendous amount of room for…
Summary of Sand Segment Initiatives In light of the current market downturn, the management team is working on a number of revenue and cost initiatives to help mitigate the impact of pricing and volume pressure. Customers are now…
Summary of Fuel Segment Initiatives The recent volatility in fuel prices has created obstacles in the fuel segment, but the team has developed a number of answers for the current market conditions. Leverage strong relationships and…
APPENDIX www.emergelp.com PAGE 17
Management and Board of Directors Years of Name Title Professional Experience Senior Management Team Rick Shearer Chief Executive Officer of EMES; CEO of Sand Division 42 Warren B. Bonham Vice President, Fuel; President of Fuel…
APPENDIX: SAND SEGMENT www.emergelp.com PAGE 19
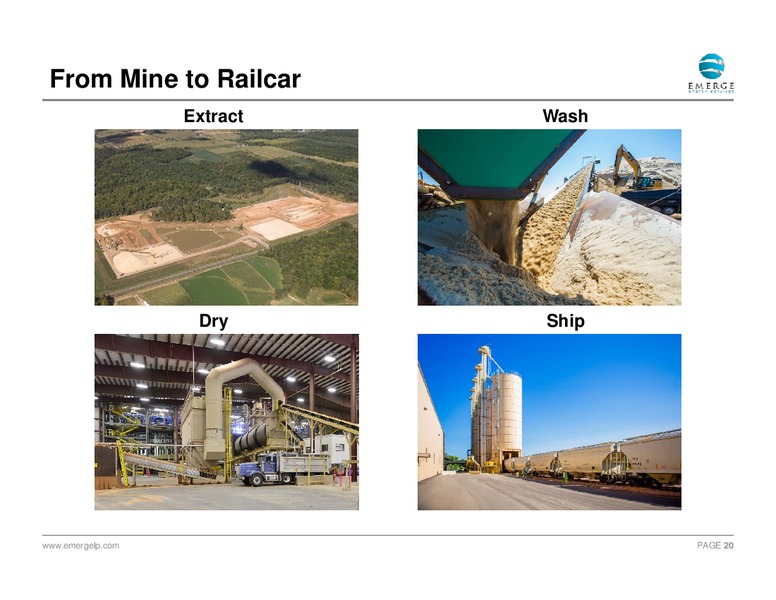
From Mine to Railcar Extract Wash Dry Ship www.emergelp.com PAGE 20
Diversified Sales Portfolio LTM 3Q15 Tons Sold by Basin LTM 3Q15 Tons Sold by Customer 1% 1% 3% 1% 5% 12% 5% 2% 26% 31% 3% 4% 9% 4% 5% 12% 5% 20% 5% 20% 12% 14% Eagle Ford Marcellus Canada Permian Cust A Cust B…
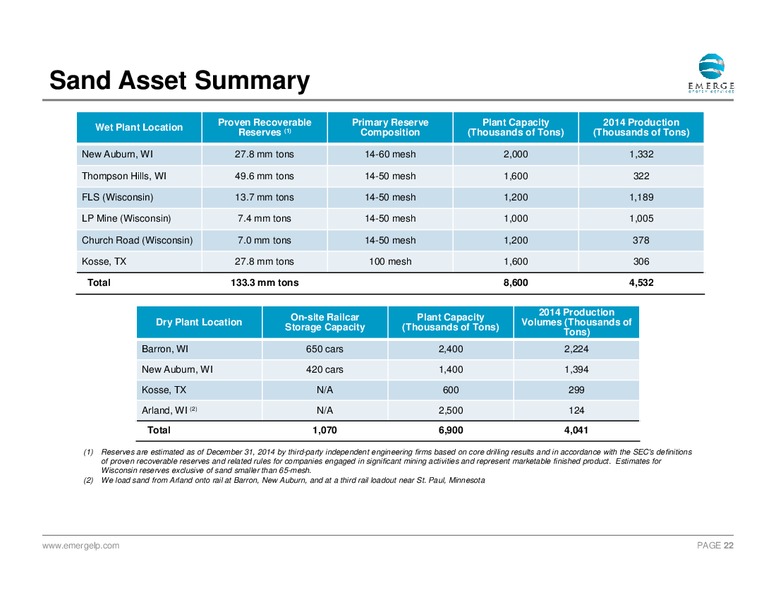
Sand Asset Summary Wet Plant Location Proven Recoverable Primary Reserve Plant Capacity 2014 Production Reserves (1) Composition (Thousands of Tons) (Thousands of Tons) New Auburn, WI 27.8 mm tons 14-60 mesh 2,000 1,332 Thompson…
Current Operations Process Flow Thompson Hills FLS/Arland LP Mine Church Road Barron Arland CN New Auburn New Auburn MNNR BNSF, UP CN, CP, UP Kosse Kosse www.emergelp.com PAGE 23
North American Sand Markets EMES has single-line access to four Class One railroads, which provide direct rail access to every major basin in North America National Network BNSF CN/GTW CP/SOO CSX /NS KCS/KSCSM UP Basin…
APPENDIX: FUEL SEGMENT www.emergelp.com PAGE 25
Fuel Segment Operations Fuel Segment provides a stable base with meaningful growth opportunities. Transmix Terminal 2014 2014 Terminal 2014 Fuel from Pipeline Processing Tankage Wholesale Throughput Transmix Sold Connectivity…
Overview of Fuel Segment Business Fuel segment revenue comes from a diverse mix of stable margin and fixed-fee activities. Product Source EMES Consumer Wholesale and Terminal Gasoline Vapor Recovery Unit Diesel Truck…
Refined Product Pipelines in the US Transmix facilities are primarily located along major refined products pipelines Direct AEC Fuels Refined Products Pipeline Transmix Facilities EMES FP&D Facilities www.emergelp.com PAGE…
Per Gallon Fuel Margins A severe price correction and one time price concessions impacted Q3 2015 margins. Those are expected to reverse in Q4 2015. Aggregate per Gallon Fuel Margin 0.200 0.150 0.100 0.050 (0.050)…
Recent Financial Results Unaudited Quarterly Financial Results for Emerge Energy Quarter Ended, Sept 30, June 30, Mar 31, Mar 31, Dec 31, 2014 Sep 30, 2014 Jun 30, 2014 2015 2015 2015 2014 Revenue 176,320 200,852 203,961 242,562…
Non-GAAP Reconciliation: Adjusted EBITDA The following table presents a reconciliation of Adjusted EBITDA to the most directly comparable GAAP financial measures for each of the periods indicated. Quarter Ended, Sept 30, June 30, Mar…
 Loading...