Third Quarter 2016 Earnings Conference Call & Webcast November 15, 2016 0
Penn Virginia Today Focused Eagle Ford Operator Successfully completed restructuring 100% of unsecured notes converted to equity New revolving credit facility 15.0 million shares outstanding Approximate Location of Granite Wash…
Successful Restructuring 100% of senior unsecured notes and general unsecured claims converted to newly-issued common equity PVAC 15 million shares outstanding Listed on OTC Pink today Expect to trade on OTCQX by end of November…
Eagle Ford Acreage Map Contiguous Acreage in Northeast Section of the Trend 81,593 gross / 53,045 net Eagle Ford acres Net of 33,623 gross / 28,491 net non-core acres expiring by YE 2017 93% held by production Penn Virginia…
Recent Activity in Gonzales and Lavaca Counties Slickwater Completions To Date and Offset Activity Fayette PVAC Sable Unit PVAC Hawg Hunter Unit 4H : DUC 3H : IP 3,563 BOEPD 5H : DUC 4H : IP 4,052 BOEPD 6H : Surface Casing Set 5H…
Eagle Ford Operations Overview Focus on Oilier Part of the Play Operate 301 wells plus interest in 36 outside-operated wells Third quarter 2016 Eagle Ford production: 889 MBOE or 9,659 BOE per day High oil content, especially in…
Efficiency is Leading to Better Returns Footage Drilled Per Day 1,700 1,600 Drilling efficiencies have increased 57% in three 1,500 years 1,400 D&C costs 52% lower in that same time period 1,300 Transition to slickwater and…
Over 50% Rate of Return at 50 Oil for Area 1 Area 1 Lower Eagle Ford Slickwater Type Curve AREA 1 TYPE CURVE 1,200 300 Total Well Cost 4.8 MM Daily Average Oil - BOPD 1,000 250 Frac Stages 24 Cumulative Oil - MBO Lateral…
2017 Preliminary Guidance Plan to Spud 16 to 19 Net Wells in 2017 Preliminary 2017 CAPEX plan of 95 to 115 G&A Trend (1) million, 85% on D&C capital 50 3,600 to 3,900 MBOE of total production expected in 2017, 70% to 72% from oil…
Eagle Ford Development Plan Concentrate initial development in Area 1 Spudding third well on three-well Sable pad, turn to sales Q4 2016 Moving to 3-well Axis pad in late Q4 2016, turn to sales Q1 2017 Q4 2016 / 2017 development…
FINANCIALS
Q3 2016 Financial Overview For the combined Successor & Predecessor(1) periods of Q3 2016: Highlights ( millions) Total Production (MBOE) 979 Total Product Revenues 33.3 (2) Total Production per Day (BOEPD) 10,629 Cash Direct…
Strong Liquidity New revolving credit facility Current Liquidity (as of November 11) 200 million commitment 128 million borrowing base 140 128 54.4 million drawn at end of Q3 120 39.0 7.6 96.6 Drawn 39.0 million drawn at Nov…
Hedge Portfolio Well Hedged Through 2019 Oil Hedges Substantial portion of oil production is hedged using swaps Mark to market at quarter end was a net liability of 14.7 million Natural gas and NGL volumes are unhedged 7,000…
Conclusion Very attractive asset base in prime area of Eagle Ford Excellent Multi-year inventory of high rate of return Assets drilling locations Upside potential Strong Balance Low cost producer Sheet Strong balance sheet and…
Q&A
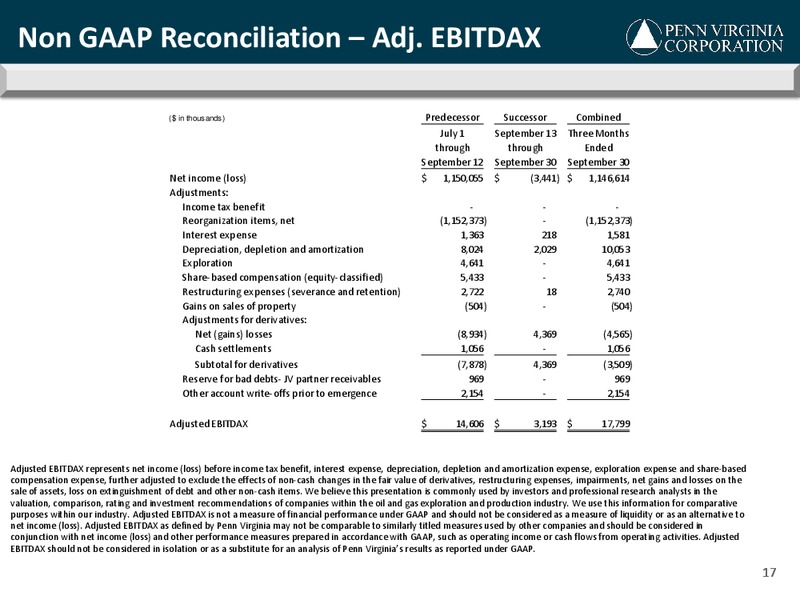
Non GAAP Reconciliation Adj. EBITDAX ( in thousands) Predecessor Successor Combined July 1 September 13 Three Months through through Ended September 12 September 30 September 30 Net income (loss) 1,150,055 (3,441) 1,146,614…
Non GAAP Reconciliation G&A Expense General and Administrative Expense ( in thousands) Year Ended December 31, 2014 2015 YTD 3Q2016 General and administrative expense, as reported 49,005 43,328 40,421 Adjustments:…
 Loading...