4th Frac Sand Conference Minneapolis, MN Sept. 13, 2016 Presented by Rick Shearer President & CEO Superior Silica Sand
Oil & Gas Industry Dynamics Are Swift & Dramatic This historic down cycle has demanded a new proppant supplier business model Fracking technology and efficiencies have been necessary to compete globally This dynamic evolution has…
Sand Industry Demand Robust Projections Recently revised estimates from Wall Street analysts indicate sand demand could surpass historical peak levels by 2017 The recovery in the sand market will be driven by increased rig count and…
Frac Sand Industry Demand The Permian and Eagle Ford basins currently consume nearly 50% of total North American frac sand demand. Recently revised estimates from leading Wall Street analysts indicate sand demand will accelerate over…
Driving Proppant Usage While overall sand consumption is declining as well count decreases, the amount of sand per well continues to increase, setting the stage we believe for a strong recovery. The drilled but uncompleted wells backlog…
Frac Sand Industry Capacity The majority of frac sand capacity is located in Wisconsin, Illinois, and Texas. Tier 1 players can have a cost structure (FOB plant) of 10-25/ton while Tier 2 can range from 20-50/ton
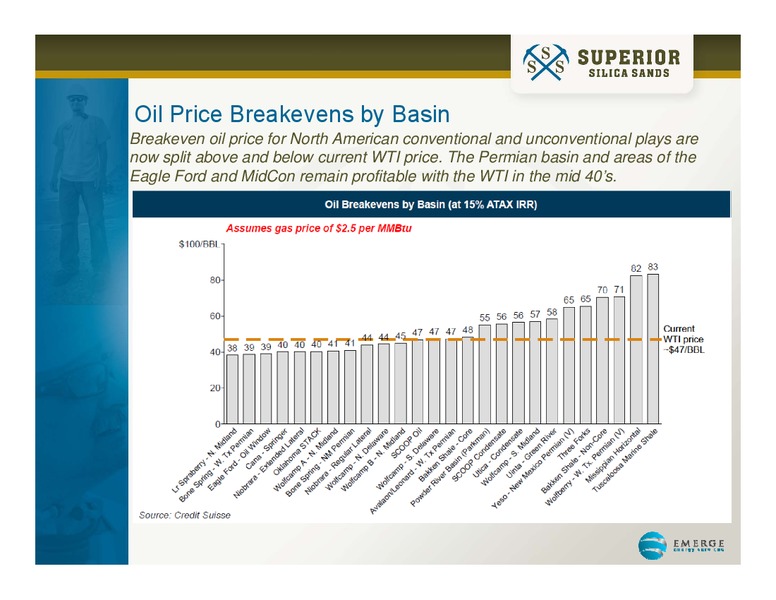
Oil Price Breakevens by Basin Breakeven oil price for North American conventional and unconventional plays are now split above and below current WTI price. The Permian basin and areas of the Eagle Ford and MidCon remain profitable with…
Weighing Proppant Quality vs. Economics Landed costs are critical procurement factors especially in todays down cycle market A divided customer base exists now, and likely long-term Coarse sand demand will return Logistics…
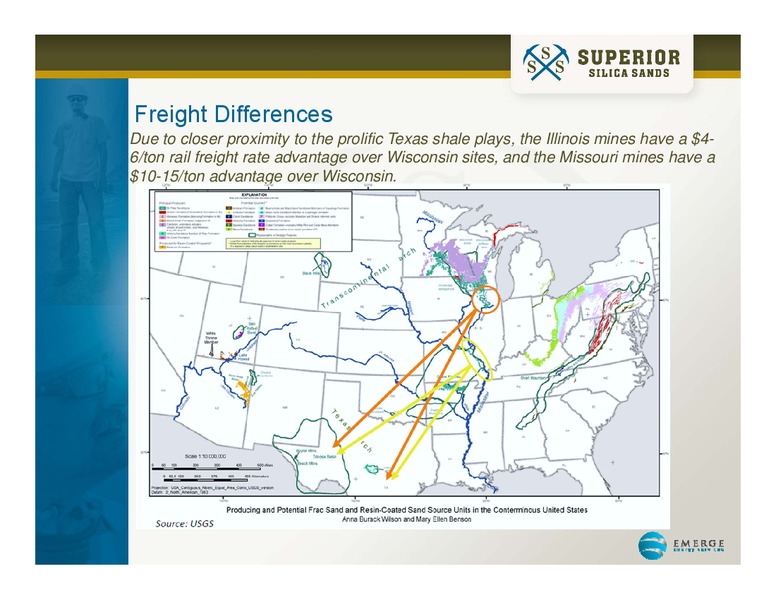
Freight Differences Due to closer proximity to the prolific Texas shale plays, the Illinois mines have a 4- 6/ton rail freight rate advantage over Wisconsin sites, and the Missouri mines have a 10-15/ton advantage over Wisconsin.
Frac Sand Mine Regional Maps The frac main sand producing regions of the US consist of the Upper Midwest, Central US, and Texas / Oklahoma.
Preparing for Long-Term Success Having quality Northern White sand & regional sand mines A broad footprint of unit train capable transload facilities, ample railcars, with multiple rail carrier origins Strong railroad alliances…
 Loading...