Oil sands drive 14% liquids growth 2017 budget overview Increasing oil production by 14% Holding the line on per barrel oil operating costs Resuming construction of Christina Lake phase G Allocating growth capital to attractive…
2017 budget captures cost improvements Total capital guidance of 1.2 1.4 billion Capital highlights 2017F 2016F % change 70% sustaining and maintenance; 30% growth and other Total capital ( billions) 1.2 1.4 1.0 1.1 24% 115 million…
Clear capital allocation priorities Safe & reliable Sustainable returns Value added Discretionary operations to shareholders growth capital financial discipline cost leadership focused innovation Portfolio optimization,…
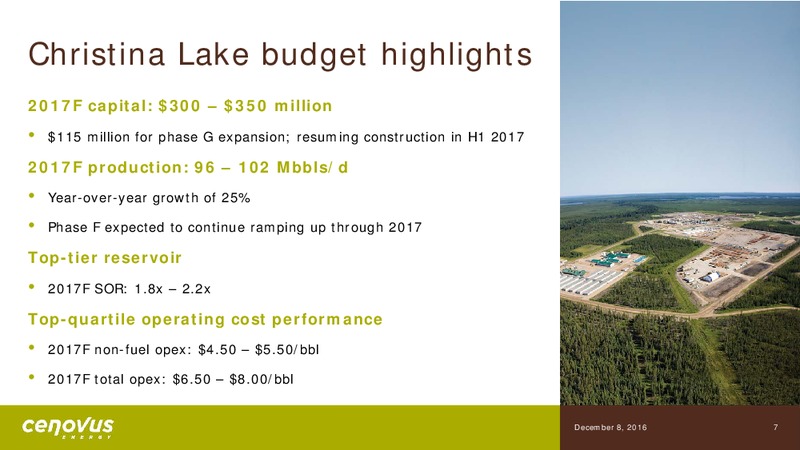
Christina Lake budget highlights 2017F capital: 300 350 million 115 million for phase G expansion; resuming construction in H1 2017 2017F production: 96 102 Mbbls/d Year-over-year growth of 25% Phase F expected to continue ramping up…
Phase G builds on Christina Lake success Best-in-class oil sands project Christina Lake phase G 100% gross Proven track record in project development Project oil capacity (bbls/d) 50,000 Industry-leading steam-oil ratio Steam-oil…
Foster Creek budget highlights 2017F capital: 325 375 million Constructing sustaining pads for 2018-2019 2017F production: 76 82 Mbbls/d Year-over-year growth of 14% Phase G expected to continue ramping up through 2017 2017F SOR:…
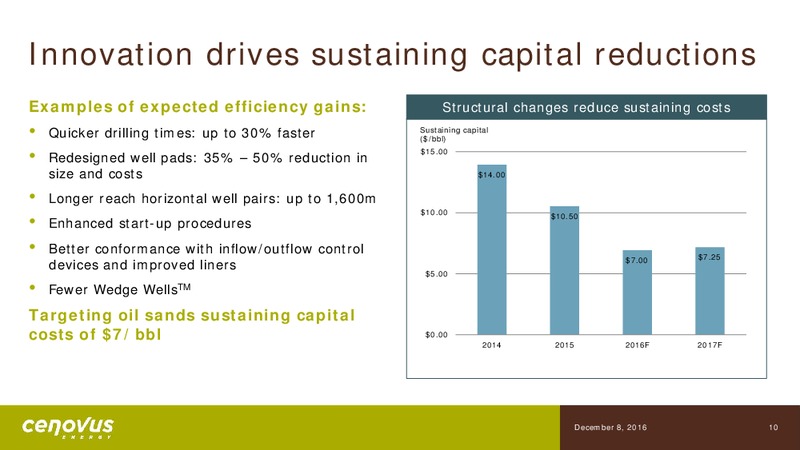
Innovation drives sustaining capital reductions Examples of expected efficiency gains: Structural changes reduce sustaining costs Quicker drilling times: up to 30% faster Sustaining capital (/bbl) 15.00 Redesigned well pads: 35% 50%…
Conventional portfolio generates free cash flow Strategy remains unchanged Free cash flow used to fund oil sands growth opportunities Flexible capital investment to respond to Pelican Lake commodity price volatility Four key…
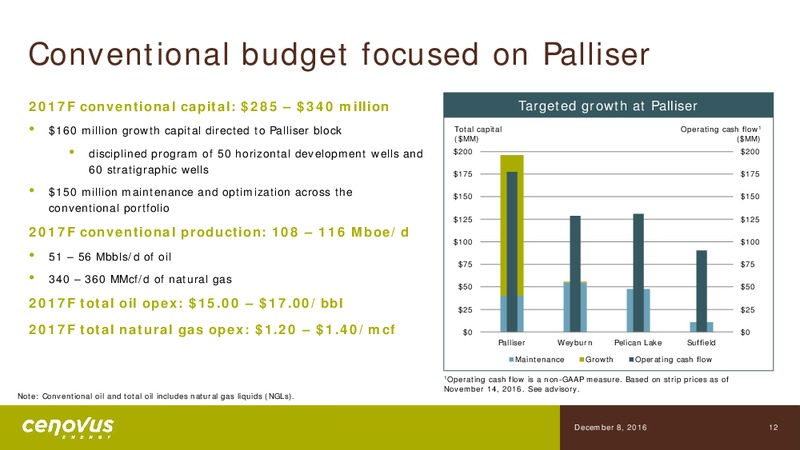
Conventional budget focused on Palliser 2017F conventional capital: 285 340 million Targeted growth at Palliser 160 million growth capital directed to Palliser block Total capital (MM) Operating cash flow1 (MM) disciplined program…
Palliser block is an attractive opportunity Taking a disciplined approach to development Unrisked location inventory Low-cost and short-cycle time growth opportunities Over 1,200 sections of leased and available Mannville oil lands…
Oil sands drive 14% liquids growth 2017 budget overview Increasing oil production by 14% Holding the line on per-barrel oil operating costs Resuming construction of Christina Lake phase G Allocating growth capital to attractive…
Supplemental information
Hedging summary Current crude oil hedges at December 7, 2016 bbls/d C/bbl 100,000 75.00 H2 2016 average H1 2017 average H2 2017 average H1 2018 32% 30% 26% 70.00 75,000 65.00 50,000 60.00 25,000 55.00 0 50.00 H2 2016 H1…
 Loading...