Substantial Reserves and Resources Regulatory approval in place or in process for nearly 500,000 bpd of potential resource development * 2016 production guidance Proved Probable 1,474 1,514 Proved and Probable Evaluated by…
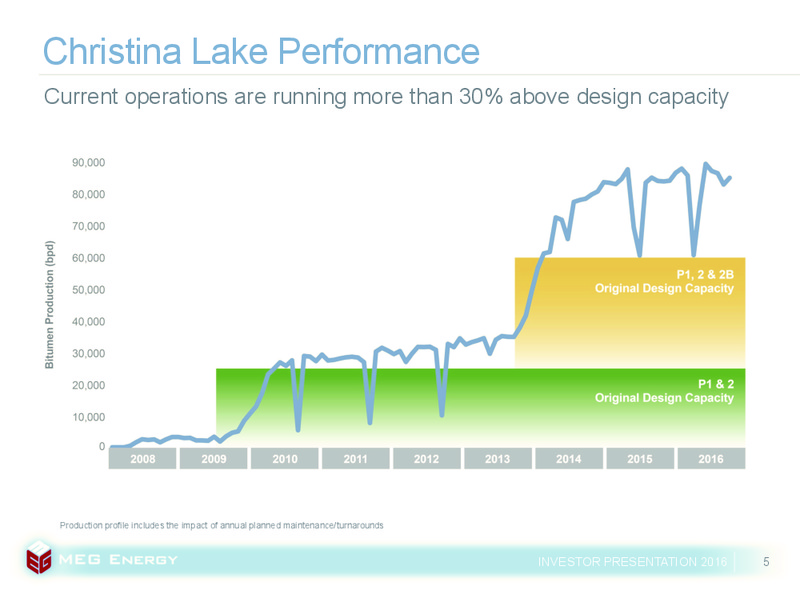
Christina Lake Performance Current operations are running more than 30% above design capacity Production profile includes the impact of annual planned maintenance/turnarounds INVESTOR PRESENTATION 2016 5
Opportunities to De-lever Goal to strengthen balance sheet in advance of renegotiation of debt maturing in 2020 INVESTOR PRESENTATION 2016 6
High-Return, Short-Cycle Growth The pace of development will be driven by commodity prices and continued reduction of MEGs cost base Builds off success of eMSAGP on Phases 1 and 2 To be applied to Phase 2B wells over the next two…
Phase 1 eMSAGP Performance Resource recovery on track to exceed 70%, 10% higher than SAGD Phase 1 single well-pattern performance* * eMSAGP production data reflects average well performance across A1 to A3 (SAGD only) and average…
Phase 1 and 2 eMSAGP SOR Comparison eMSAGP deployed across 30% of MEGs production base with very consistent results, could be applied to Phase 2B over the next two years INVESTOR PRESENTATION 2016 9
Implications of Efficiency Gains from eMSAGP eMSAGP results in SORs being reduced by almost half Enables more production with the same amount of steam Production increased via Infill wells New SAGD well pairs where freed-up…
Highly Economic Production Growth Incremental production adds minimal operating costs, generates very strong netbacks and is highly accretive to cash flow Illustrative impact of production growth on netbacks. Example assumes a…
Net GHG Intensity Performance eMSAGP and cogeneration have enabled MEG to lower its GHG intensity 30% below in situ industry average * Phase start-up: higher steam requirements with low initial production ** Net GHG intensity…
Efficiency Gains Reduce Breakeven Costs Ongoing efficiency gains drive lower operating costs and reduce MEGs breakeven costs in a low oil price environment C per barrel unless specified * Operating breakevens calculated based on…
Focused Cost Management Sustainable cost savings achieved through continued technological advancement and reductions in overall cost base At current strip prices, MEG anticipates its US2.5 billion revolver will be undrawn at…
2016 Capital and Operational Guidance Revised Capital Investment Plan Operational Guidance 5.75 to Sustaining & maintenance 6.50 per barrel and other capital Non-energy operating costs 140 million Downwardly revised from…
Sustaining Capital Low sustaining capital requirements supported by low decline rates allow MEG to dedicate a higher proportion of capital towards growth C/bbl Sources: BMO Capital Markets estimates of 2016 sustaining capital,…
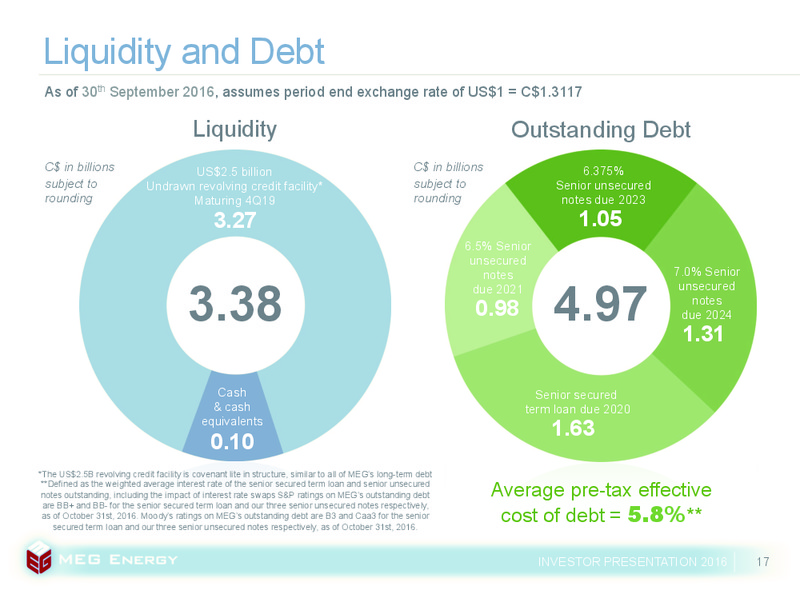
Liquidity and Debt As of 30th September 2016, assumes period end exchange rate of US1 = C1.3117 Liquidity Outstanding Debt C in billions US2.5 billion C in billions 6.375% subject to Undrawn revolving credit facility* subject to…
Debt Maturity All debt is covenant-lite: free of any financial maintenance covenants INVESTOR PRESENTATION 2016 18
Crude Oil Hedges Crude oil hedges in place as of 27th October 2016 * Percentage of hedged volumes are based on the mid-point of 2016 annual production guidance of 80,000 - 83,000 bpd and assumes a ratio of 0.31 barrel of diluent…
Investor Relations Helen Kelly Director, Investor Relations 403.767.6206 helen.kellymegenergy.com John Rogers VP, Investor Relations and External Communications 403.770.5335 john.rogersmegenergy.com www.megenergy.com/investors
 Loading...