Emerge Energy Services LP Investor Presentation November 2016 www.emergelp.com PAGE 1
Competitive Strengths High Quality, Technology Strategically Driven New Located Assets Products Significant Intrinsic Organic Logistics Growth Advantages Capacity Trusted Reputation w/ Low Cost Customers and…
After Divesting the Fuel Business, the Sand Business Now Makes up 100% of EMES Sand Summary Balance sheet Proceeds from the sale of the Fuel business were used to pay down the loan balance during the third quarter Summary Balance…
EMES 2016 Key Actions and Path Forward We have made considerable progress during 2016 in addressing our balance sheet. Although we are proud of these recent successes, we have laid out additional goals through our key next steps. 1…
Sand Industry Demand Robust Projections Recently revised estimates from Wall Street analysts indicate sand demand will surpass historical peak levels by 2017 The recovery in the sand market will be driven by increased rig count and…
Driving Proppant Usage While overall proppant consumption has declined through the first half of 16 as drilling activity has decreased, the amount of proppant per well continues to increase across the major basins. The drilled but…
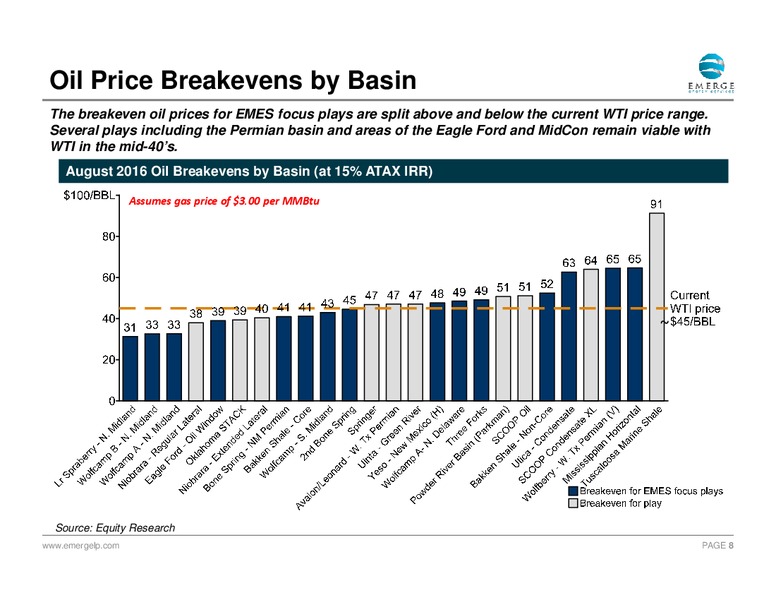
Oil Price Breakevens by Basin The breakeven oil prices for EMES focus plays are split above and below the current WTI price range. Several plays including the Permian basin and areas of the Eagle Ford and MidCon remain viable with WTI…
Technology Driven Proppant: SandMaxxTM We are excited about our new self-suspending proppant, SandMaxxTM, which provides an enhanced completion design by allowing the proppant to contact more fissures compared to a completion with…
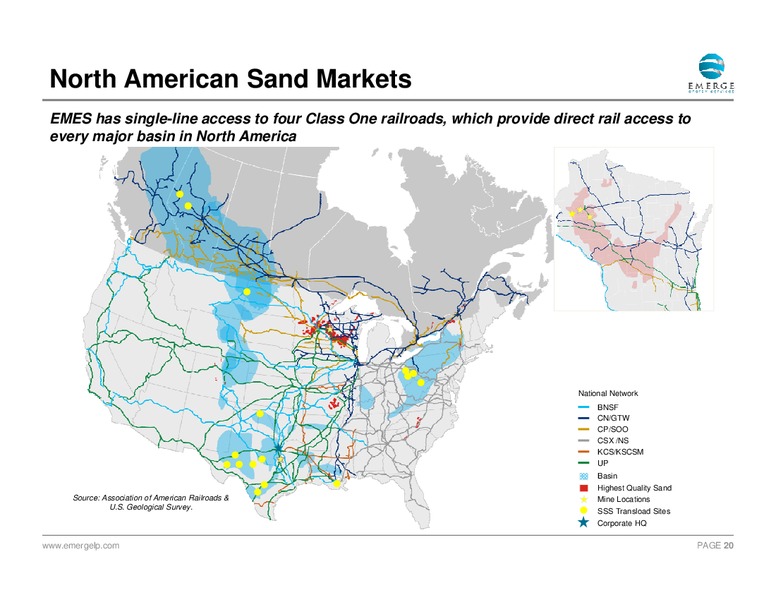
Strong Logistics Platform Our Wisconsin sand facilities have direct access to four Class One rail lines and can reach all major shale plays in North America on single-line hauls. Logistics Highlights Wide Geographic Presence Emerge…
Significant Capital Invested & Underutilized Assets The company has invested a significant amount of capital in its sand facilities. With moderate utilization in the current market, we believe our assets have substantial room for growth…
Initiatives Summary In light of the current market downturn, the management team is working on a number of revenue and cost initiatives to help mitigate the impact of pricing and volume pressure. We remain focused on driving…
Summary Quarterly Performance in thousands, except per ton 2016 2015 2014 Q3 Q2 Q1 Q4 Q3 Q2 Q1 Q4 Continuing Operations: Tons Sold (tons in 000's) 493 399 439 581 799 861 1,151 1,233 Revenue 31,285 24,825 29,670 44,502 60,654 68,118…
APPENDIX www.emergelp.com PAGE 14
Management and Board of Directors Years of Name Title Professional Experience Senior Management Team Rick Shearer Chief Executive Officer of EMES; CEO of SSS 42 Warren B. Bonham Vice President of EMES 31 Deborah Deibert Chief…
From Mine to Railcar Extract Wash Dry Ship www.emergelp.com PAGE 17
Asset Summary Wet Plant Location Proven Recoverable Primary Reserve Plant Capacity 2015 Production Reserves (1) Composition (Thousands of Tons) (Thousands of Tons) New Auburn, WI 15.5 mm tons 14-60 mesh 2,000 755 Thompson Hills, WI…
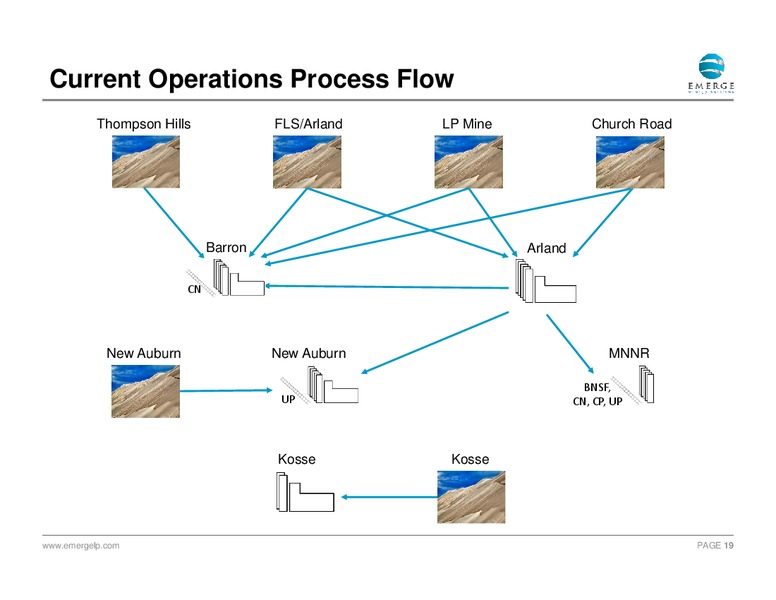
Current Operations Process Flow Thompson Hills FLS/Arland LP Mine Church Road Barron Arland CN New Auburn New Auburn MNNR BNSF, UP CN, CP, UP Kosse Kosse www.emergelp.com PAGE 19
North American Sand Markets EMES has single-line access to four Class One railroads, which provide direct rail access to every major basin in North America National Network BNSF CN/GTW CP/SOO CSX /NS KCS/KSCSM UP Basin…
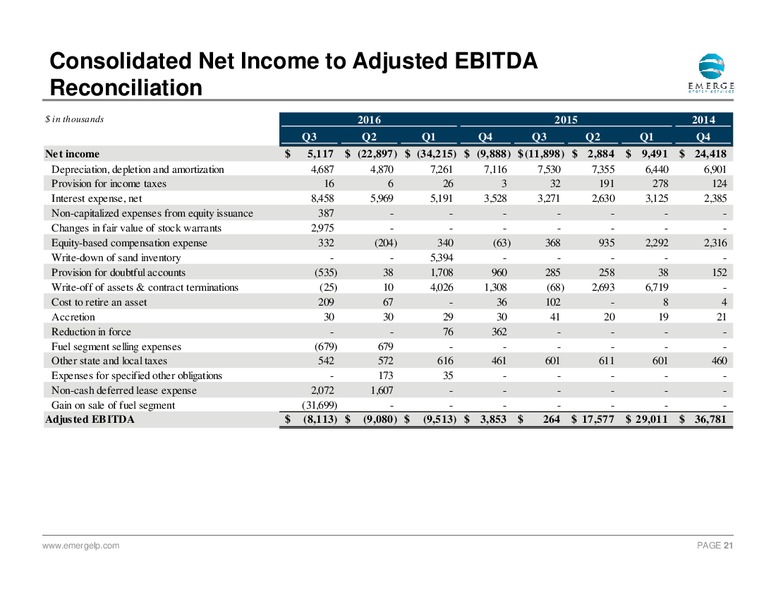
Consolidated Net Income to Adjusted EBITDA Reconciliation in thousands 2016 2015 2014 Q3 Q2 Q1 Q4 Q3 Q2 Q1 Q4 Net income 5,117 (22,897) (34,215) (9,888) (11,898) 2,884 9,491 24,418 Depreciation, depletion and amortization 4,687 4,870…
 Loading...