Hello and welcome. This is BPs fourth-quarter and full-year 2016 results webcast and conference call. Im Jess Mitchell, BPs Head of Investor Relations and Im here with our Group Chief Executive, Bob Dudley, and our Chief Financial…
During todays presentation, we will make forward-looking statements that refer to our estimates, plans and expectations. Actual results and outcomes could differ materially due to factors we note on this slide and in our UK and SEC…
Thanks Jess. 4
Welcome everybody and thank you for joining us. Were reporting on another challenging quarter today, and another challenging year for the industry. But for BP its been a very eventful quarter and one where weve continued to make good…
By the end of last year we were seeing Brent oil prices around where they are today in the mid-50s but in 2016 the average oil price was 44 per barrel, the lowest for twelve years. Henry Hub gas prices were also weak in 2016, averaging…
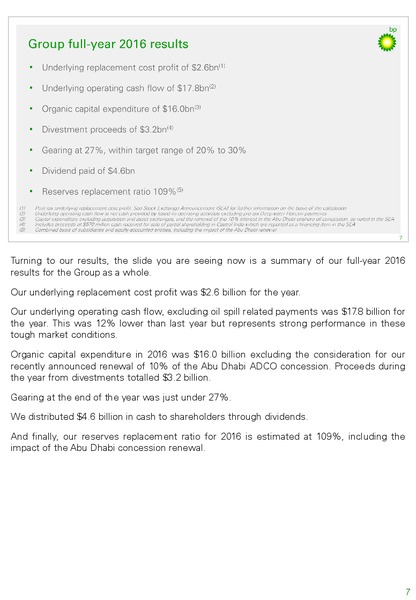
Turning to our results, the slide you are seeing now is a summary of our full-year 2016 results for the Group as a whole. Our underlying replacement cost profit was 2.6 billion for the year. Our underlying operating cash flow, excluding…
Putting these numbers in perspective, we finished the year ahead of where we expected to be at this point in rebalancing our organic financial frame, supported by the significant and rapid structural changes weve made to our cost base.…
This slide pulls together some of our key activities last year, many of which came in a busy final quarter for announcements. Earlier in the year we completed the merger of our Norwegian North Sea portfolio with Det Norske to form Aker…
In the Downstream we announced a new strategic partnership with Woolworths, one of Australias largest supermarket retailers. Subject to regulatory approvals, this will see us acquiring and operating over 500 fuel and convenience sites as…
So we have been busy but our commitment to keeping our people and operations safe has remained our top priority. This slide shows our progress at the Group level. Overall the data suggests we have maintained the progress made in…
Thanks Bob. 11
Looking more specifically at the oil price for the fourth quarter. Brent crude averaged 49 per barrel in the fourth quarter, up from 46 per barrel in the third quarter. Following the production cut announced by OPEC and non-OPEC…
Turning now to the results. BPs fourth-quarter underlying replacement cost profit was 400 million compared with 200 million a year ago and 930 million in the third quarter of 2016. Compared to a year ago, the result reflects: Lower…
In Upstream, the fourth-quarter underlying replacement cost profit before interest and tax of 400 million compares with a loss of 730 million a year ago and a loss of 220 million in the third quarter of 2016. Compared to the fourth…
Now turning to Downstream, the fourth-quarter underlying replacement cost profit before interest and tax was 880 million compared with 1.2 billion a year ago and 1.4 billion in the third quarter. The Fuels business reported an underlying…
quarter. This result brings our full year pre-tax earnings to a record 1.5 billion. The Petrochemicals business reported an underlying replacement cost profit of 100 million in the fourth quarter. This brings our full year pre-tax…
Based on preliminary estimates, we have recognised 135 million as BPs share of Rosnefts underlying net income for the fourth quarter compared with 120 million last quarter. This reflects higher Urals prices and duty lag benefits partially…
In Other Businesses and Corporate, the pre-tax underlying replacement cost charge was 420 million for the fourth quarter, an increase of 120 million on the same period a year ago reflecting adverse foreign exchange impacts. The average…
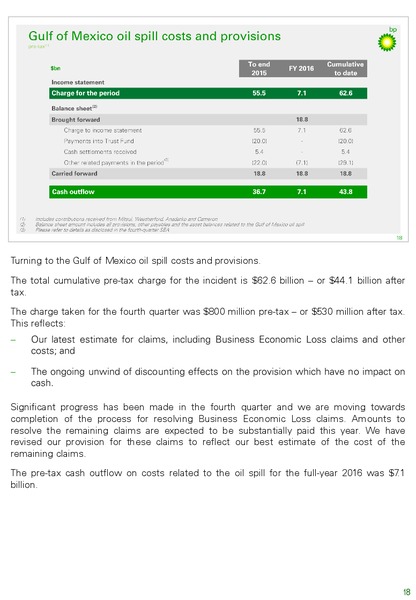
Turning to the Gulf of Mexico oil spill costs and provisions. The total cumulative pre-tax charge for the incident is 62.6 billion or 44.1 billion after tax. The charge taken for the fourth quarter was 800 million pre-tax or 530 million…
Looking next at cash flow, this slide compares our sources and uses of cash in 2015 and 2016. Underlying operating cash flow, which excludes pre-tax oil spill related outgoings, was 17.8 billion in 2016, of which 4.5 billion was…
In 2017 we see a number of factors impacting our financial framework. In addition to what we anticipate will be a stronger environment compared to 2016, we expect Group operating cash flow to reflect the full cumulative effect of having…
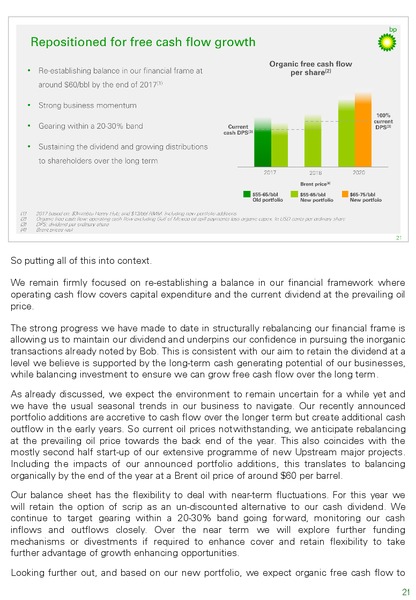
So putting all of this into context. We remain firmly focused on re-establishing a balance in our financial framework where operating cash flow covers capital expenditure and the current dividend at the prevailing oil price. The strong…
start to grow at around this same price level. We expect this to be supported strongly over the medium term by the ramp-up of our new slate of Upstream project start-ups, strong marketing growth and from the accretive effects of our…
This slide summarises our remaining guidance for 2017. We expect full-year underlying production in 2017 to be higher than 2016 primarily due to our major project start-ups. We also expect actual reported production to be materially…
Thanks Brian. 23
Id now like to take a closer look at how our Upstream and Downstream businesses are contributing to the picture of growing resilience that Brian has set out. Looking first at the Upstream, we achieved a lot in 2016 in a challenging price…
through our agreement with Kosmos Energy in Mauritania and Senegal, again the 10% share in the Zohr field in Egypt, two new deepwater exploration blocks in the Saline basin in Mexico and our previously announced new access in China and…
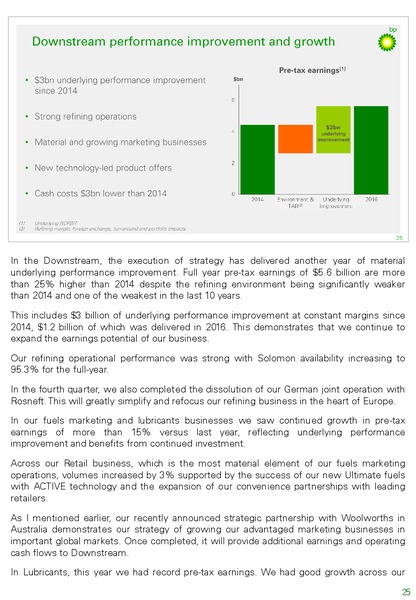
In the Downstream, the execution of strategy has delivered another year of material underlying performance improvement. Full year pre-tax earnings of 5.6 billion are more than 25% higher than 2014 despite the refining environment being…
growth markets and premium brands, such as Castrol. And, through technology we continued to develop new offers and lower carbon products for our customers. In addition to Ultimate fuels, we also launched new products in Lubricants and…
Now its time we moved on to take some questions, but let me briefly sum up what youve heard from us. First and foremost, our strong focus on safety and reliability is underpinning a track record of continually improving operational…
 Loading...