2016 Results Highlights Revenues of Ps 210.1 billion (+34.6%) Adj. EBITDA(1) was Ps 58.2 billion (+22.4%) Net loss of Ps 28.4 billion due to a Ps 34.9 billion impairment charge recorded in Q3 2016; Net Profit of 1.8 billion in Q4…
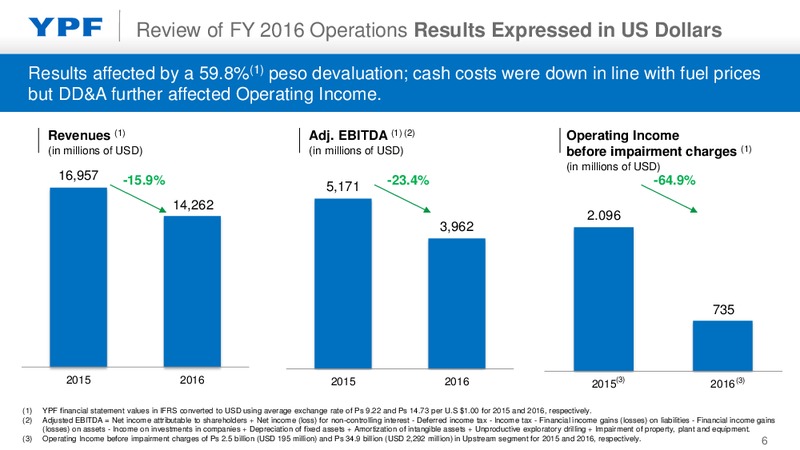
Review of FY 2016 Operations Results Expressed in US Dollars Results affected by a 59.8%(1) peso devaluation; cash costs were down in line with fuel prices but DD&A further affected Operating Income. Revenues (1) Adj. EBITDA (1) (2)…
Review of Q4 2016 Operations Results Expressed in US Dollars Quarterly results affected by a 52.2% peso devaluation; cash costs were down in line with fuel prices but DD&A further affected Operating Income. Revenues (1) Adj. EBITDA…
Review of FY 2016 Operations Production Total production was flat vis-a-vis 2015 with 0.9% growth in natural gas and 6.9% growth in NGL; crude oil production was down by 2.0%. Crude oil production Natural gas production Total…
Review of FY 2016 Operations Reserves Proved Reserves decreased by 9%, mainly due to lower crude oil prices. Total hydrocarbon reserves (Mboe) RRR: 46% 1.283 1.212 1.226 1.132 1.083 1.113 1.014 982 1.005 979 2007 2008 2009…
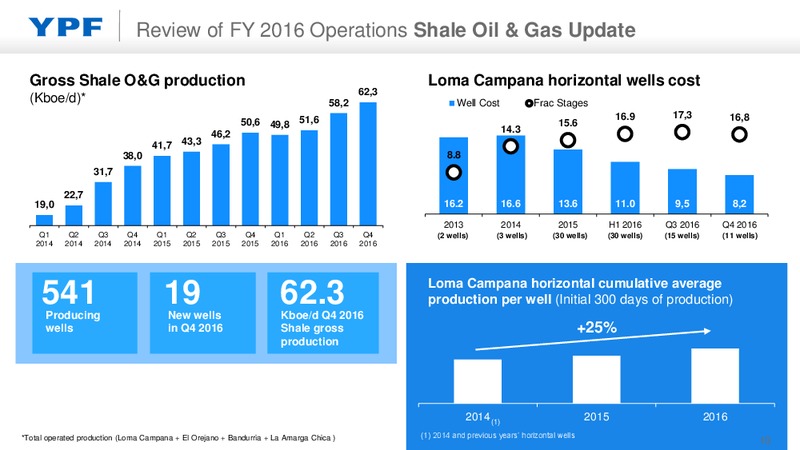
Review of FY 2016 Operations Shale Oil & Gas Update Gross Shale O&G production Loma Campana horizontal wells cost 62,3 (Kboe/d)* 58,2 Well Cost Frac Stages 16.9 17,3 16,8 50,6 49,8 51,6 15.6 46,2 14.3 41,7 43,3 38,0 8.8 31,7…
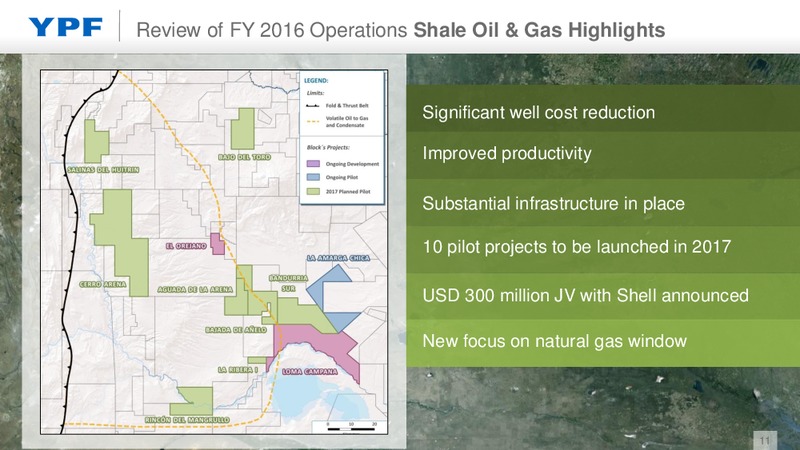
Review of FY 2016 Operations Shale Oil & Gas Highlights Significant well cost reduction Improved productivity Substantial infrastructure in place 10 pilot projects to be launched in 2017 USD 300 million JV with Shell announced New…
Review of FY 2016 Operations Shale Oil Benchmarking Proved Well Reservesindecreased productivity by 9%, line with best mainly in the due to lower crude oil prices. industry. Source: WoodMackenzie / YPF 12
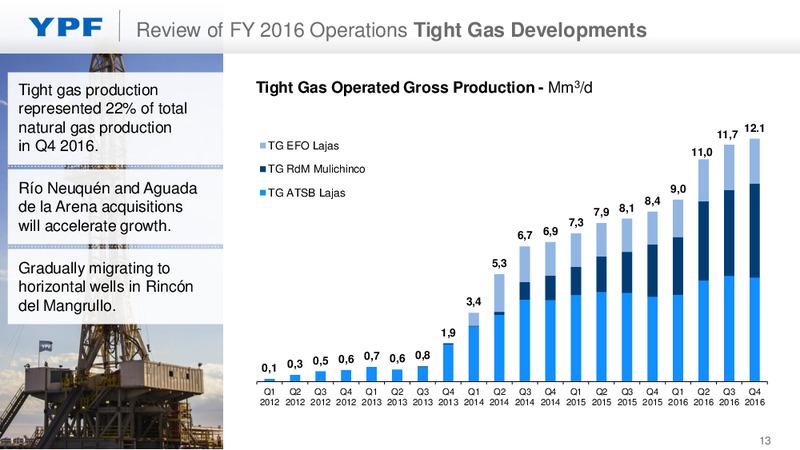
Review of FY 2016 Operations Tight Gas Developments Tight gas production Tight Gas Operated Gross Production - Mm3/d represented 22% of total natural gas production 11,7 12.1 in Q4 2016. TG EFO Lajas 11,0 TG RdM Mulichinco Ro Neuqun…
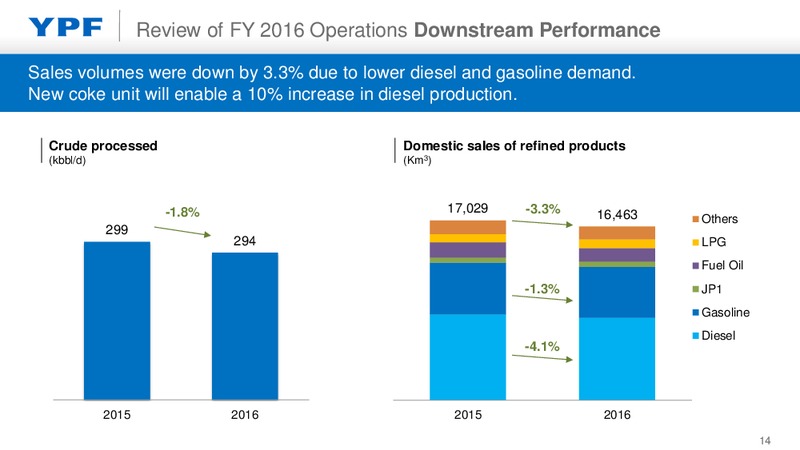
Review of FY 2016 Operations Downstream Performance Sales volumes were down by 3.3% due to lower diesel and gasoline demand. New coke unit will enable a 10% increase in diesel production. Crude processed Domestic sales of refined…
Review of FY 2016 Operations Refined Products Demand Gasoline and diesel sales were down by 1.3% and 4.1%, respectively; slight reduction in market share. Some recovery towards year end. Monthly Gasoline Sales (Km3) Monthly Diesel…
Review of FY 2016 Operations Gas & Energy Update Additional capacity from new projects (2017-2018) +575 MW Loma Campana I project start-up in Q3 2017 (100MW) Loma Campana II project start-up in Q4 2017 (105MW) Manantiales…
Review of FY 2016 Operations Performance Highlights Delivered results in line with guidance TARGET 2016 REALIZED Capex in USD 4.5 / 5 BUSD 4.3BUSD Adj. EBITDA 4BUSD 4BUSD Lifting cost reduction in USD -20% -19.7% Total…
FY 2016 Financial Results Revenues and Adj. EBITDA increased by 34.6% and 22.4% respectively. Operating Income before impairment charges decreased 44.1%. Revenues (millions of Ps) Adj.EBITDA (millions of Ps) (1) Operating Income…
FY 2016 Financial Results Operating Income Revenue increase of 35% was in line with increase in cash costs; however dollar-denominated items such as Purchases, Royalties and DD&A resulted in a decrease in Operating Income. Operating…
FY 2016 Financial Results Upstream Upstream Operating Income before impairment charge was down 51.6% mainly due to the effect of DD&A and costs associated with the reduction of activity; lifting cost was down 19.7% in real terms.…
FY 2016 Financial Results Downstream Downstream Operating Income declined 55.5% as price increases were below the increase in cost of crude oil and biofuels; volumes sold were below expectations. Operating Income (in million of Ps)…
2016 Financial Results Capex Capex was down 35.6% in USD terms and up 2.7% in pesos, mostly due to reduced activity in the Upstream segment. Upstream Downstream (in millions of Ps) Upstream Activity breakdown: 69% in drilling Gas &…
2016 Financial Situation Strong cash position by the end of 2016; Adjusted Operating Cash Flow was up due to reduction in working capital mainly related to collection of 2015 gas receivables. Consolidated statement of adjusted cash…
2016 Financial Situation Cash position strengthened by new debt issuances and strong cash flow generation in 2016. Financial debt amortization schedule (1) (2) (in millions of USD) 3,153 73% denominated in USD and 27% in Pesos…
Conclusions Outlook 2017 2016 was a transition year with management and BOD changes but strategy was reaffirmed; the Company performed in line with guidance Main accomplishments were significant improvements in Vaca Muerta and the…
 Loading...