2014-2016 Transformation Plan: Intensified, accelerated & implemented in 2014
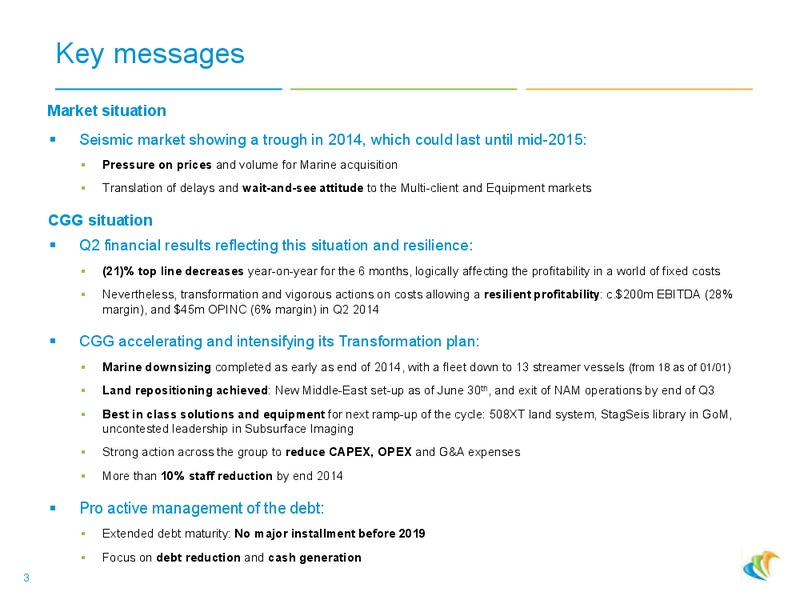
Key messages Market situation Seismic market showing a trough in 2014, which could last until mid-2015: Pressure on prices and volume for Marine acquisition Translation of delays and wait-and-see attitude to the Multi-client and…
2014: Weak market environment 2011- 2016 Exploration spending forecast In billion 123.1 117.5 118.8 110.4 109.0 106.8 (5)% +10% (7)% (2)% 2011 2012 2013 2014 2015 2016 Source : Rystad D Cube Capex discipline is a key…
2013-2014: Key figures by division In million Equipment GGR Revenues EBIT Revenues EBIT 668 540 505 626 403 153 589 176 140 20m Spectrum 140 capital gain 125 28% 80 25% 28% 21% 21% 20% H1 13 H2 13 H1 14 H1 13 H2 13 H1…
Transformation Plan: Restructuring measures implemented in 2014
Accelerating and intensifying the Transformation Plan Rebalanced business portfolio Reformatting and rebalancing of businesses Accelerating the right-sizing of the fleet from Rebalancing from cyclical and capital 18 to 13 vessels as…
Marine Acquisition: Rightsizing the fleet in 2014 Evolution of CGG streamers count (at end of period) 5 Vessels taken out: 250 (30)% Symphony decommissionned 200 1 vessel retired from the seismic market 150 2 vessels de-rigged…
Land Acquisition: a shift in business model Land revenue, incl. minority stakes Land revenue, incl. minority stakes (end of 2012) (target 2015) SW&OBS (100)% SW&OBS (40)% Seabed Geosolution JV Argas (49)% New Argas (49)% Middle…
Accelerating and intensifying the Transformation Plan Tight cash and debt management Cost control Scaling up across the board with 2.5% Strong action across the Group to reduce headcount reduction since Jan 2014 OPEX and G&A…
Debt Maturity Profile: No major installment before 2019 2013 Pro-forma Senior Debt Maturity Profile (in m) In April, issue of two new High Yield Bonds Maturity as of end of March extended from 4 years to approximately 6 years…
Balance Sheet as of end of June 2014 Total Capital Employed at 6.1bn Multi-Client library NBV up at 1,012m Increase mostly due to the IBALT program in the Gulf of Mexico Cash multi-client Capex pre-funded at 53% Amortization rate…
2014-2016 Growing pillars: Equipement & GGR
Equipment: Sercel a leading seismic equipment provider 2013 Key Figures Market Positioning Strong footprint in land, 70% market share in Total sales EBIT Number of cable systems 1,045m 293m employees Strong footprint in marine, 95%…
Equipment Division growth driven by Land equipment markets Evolution of the New Builds Market Marine driven by sustainable replacement km Sentinel sold New builds market 1000 15 800 70% sales based on replacement or spread 10…
Equipment profitability: Operating margin driven by volumes and product mix Sercels business model highly sensitive to volume sold and product mix Higher electronic content leads to a higher operating margin Revenue vs. %…
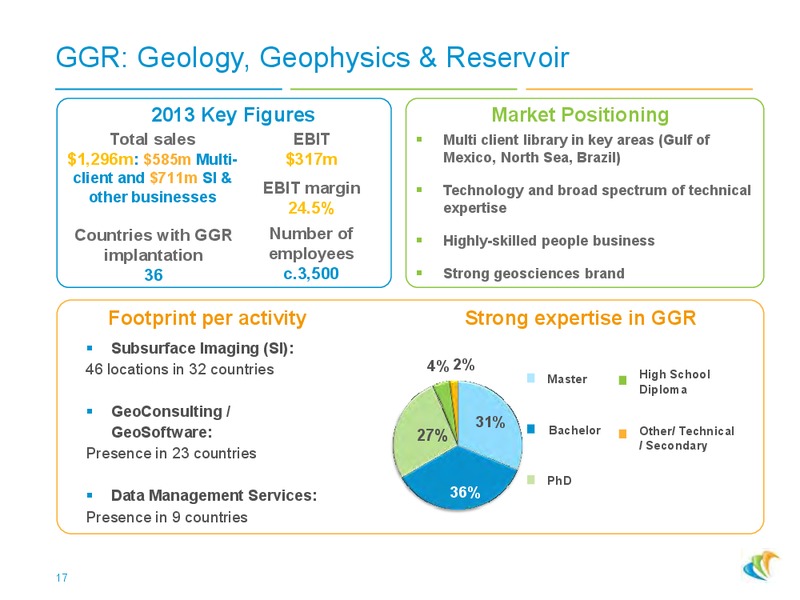
GGR: Geology, Geophysics & Reservoir 2013 Key Figures Market Positioning Total sales EBIT Multi client library in key areas (Gulf of 1,296m: 585m Multi- 317m Mexico, North Sea, Brazil) client and 711m SI & EBIT margin Technology and…
GGR multi-client: StagSeis ready on time for GoM lease rounds CGG IBALT / StagSeis footprint 3 year program started in 2012 and finishing end of 2014 20,320km2 data acquired with latest StagSeis technology Trois TROIS Deux…
Subsurface Imaging: Maintaining our leadership position with our high skilled people 43 Processing centers worldwide Processing Revenue In million 711 442 485 403 387 360 7 2009 2010 2011 2012 2013 H1 2014 6 5 PFlops…
GeoConsulting and GeoSoftware: Developing integrated workflow Geoconsulting: offering integrated projects Acknowledged leader in geopolitical multi-client products and reports, and high-end consulting services across the E&P value…
Outlook
2014 Management priorities reaffirmed Weakening Seismic market conditions due to cost cutting measures from our customer base and less predictable exploration spending CGG management intensifying and accelerating its 2014-2016…
Thank you Q2 2013, Q1 2014 and Q2 2014 are presented before Non-Recurring Charges (NRC), unless stated otherwise
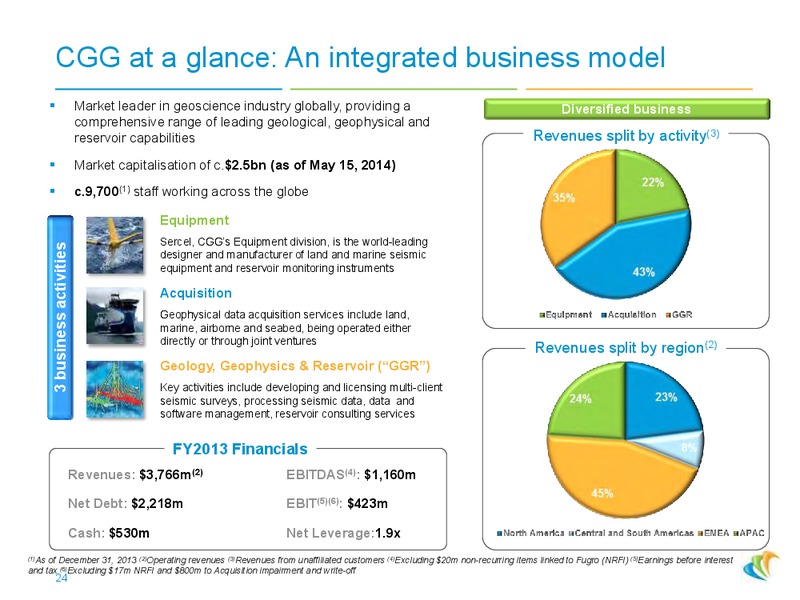
CGG at a glance: An integrated business model Market leader in geoscience industry globally, providing a Diversified business comprehensive range of leading geological, geophysical and reservoir capabilities Revenues split by…
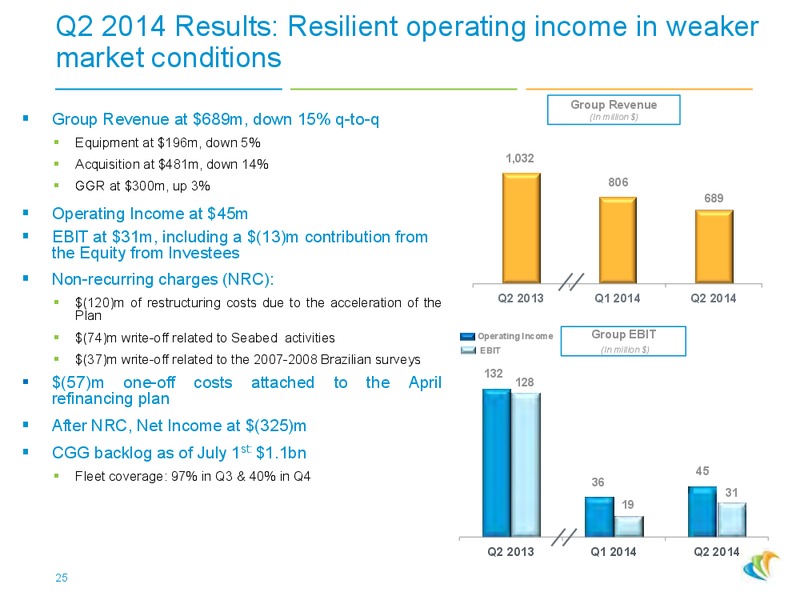
Q2 2014 Results: Resilient operating income in weaker market conditions Group Revenue Group Revenue at 689m, down 15% q-to-q (In million ) Equipment at 196m, down 5% 1,032 Acquisition at 481m, down 14% GGR at 300m, up 3% 806…
Equipment Q2 2014 : Stable profitability sequentially in weak market conditions Total sales were 196m, down 5% q-to-q Land Equipment Marine Equipment Revenue (In million ) Lower sales due to weak market conditions from 254…
Acquisition Q2 2014: Solid operational performance in a weak market Land & Airborne Acquisition Revenue Acquisition revenue at 481m, down 14% q-to-q Marine (In million ) External revenue at 241m, down 32% 605 559 94 481 106…
GGR Q2 2014: Sustained profitability despite low MC after- sales MC Revenue GGR Revenue SI & Reservoir (In million ) GGR revenue at 300m, up 3% q-to-q 367 Multi-Client at 128m, stable sequentially 206 300 290 Prefunding revenue…
Cash Performance : monitoring the capex EBITDAs Q2 EBITDAs : 194m, a 28% margin (In million ) Equipment at 50m, a 26% margin 333 Acquisition at 95m, a 20% margin GGR at 159m, a 53% margin 32% 189 194 Total Capex of 262m,…
 Loading...