Financial results Half year ended 31 December 2016 Eastern Ridge
Disclaimer Forward-looking statements This presentation contains forward-looking statements, including statements regarding: trends in commodity prices and currency exchange rates; demand for commodities; plans, strategies and objectives…
Financial results Half year ended 31 December 2016 Andrew Mackenzie Chief Executive Officer Mt Arthur Coal
Interim FY17 scorecard Strong cash generation drives debt reduction Safety Despite improvements in a range of safety measures, tragically there was a fatality at Escondida 9%1 reduction in TRIF Volume One-off events and Onshore US…
Safety is paramount The health and safety of our people and communities always comes first Tragically, there was a fatality at Escondida during the period Total Recordable Injury Frequency (TRIF) of 3.9 is down 9%1 TRIF performance…
Progress at Samarco Committed to social and environmental rehabilitation Avenida Beira Rio Barra Longa November 2015 October 2016 Rehabilitation Legal developments Mine restart Renova Foundation fully functional Constructive…
Financial results Half year ended 31 December 2016 Peter Beaven Chief Financial Officer Eagle Ford
Strong financial performance Diversified portfolio and simplified structure underpins superior margins Underlying EBITDA of US9.9 billion, up 65% Leading margins through the cycle (Underlying EBITDA margin2, %) Underlying EBIT of…
Group EBITDA waterfall Rise in EBITDA driven by commodity prices and productivity Underlying EBITDA variance (US billion) External US3.1 billion Controllable US0.8 billion 12 1.1 0.0 0.0 9.9 3.5 9.1 0.1 (0.2) (0.3) (0.1) (0.2)…
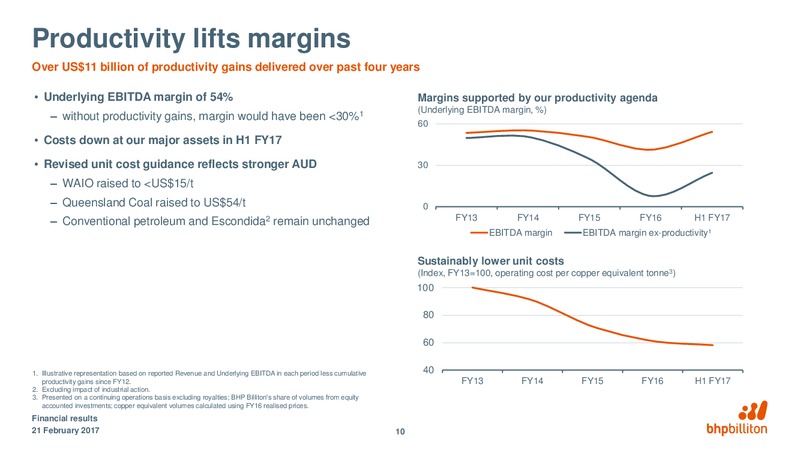
Productivity lifts margins Over US11 billion of productivity gains delivered over past four years Underlying EBITDA margin of 54% Margins supported by our productivity agenda (Underlying EBITDA margin, %) without productivity gains,…
Strong cash flow and balance sheet Simpler portfolio delivers substantial conversion of higher prices into cash flow Net operating cash flow of US7.7 billion Net debt and gearing (Net debt, US billion) (Gearing, %) despite US1.3…
Disciplined capital allocation With heightened uncertainty and elevated prices, we have a bias for debt reduction H1 FY17 Maintenance: US0.6 billion including deferred stripping US1.4 billion guidance for FY17 under revised definition…
Financial results Half year ended 31 December 2016 Andrew Mackenzie Chief Executive Officer Olympic Dam
Near-term uncertainty, attractive long-term fundamentals Copper and oil remain our preferred long-term growth commodities Short-term Medium-term Long-term Modest Growth in Urbanisation Political Steeper economic New supply…
Well placed for anticipated conditions Our diversified portfolio, strong balance sheet and competitive growth options position us well Simple portfolio of tier 1 assets, diversified across our preferred Tier 1 portfolio commodities (H1…
Progress on our roadmap We have made significant progress across a broad suite of opportunities to grow value and returns Productivity On track for full-year productivity guidance of US1.8 billion (excluding impact of Escondida…
Emerging stronger from the downturn We have responded to the challenges of recent years Progress on our roadmap of value creation and improved returns Demerger and Over US11 billion of US7 billion of productivity divestments…
Appendix
BHP Billiton guidance Group FY17e FY18e Capital and exploration expenditure (USbn) 5.6 6.3 Cash basis. Including: Maintenance 1.4 Includes non-discretionary capital expenditure to maintain asset integrity, reduce risks, and meet…
BHP Billiton guidance (continued) Copper FY17e Total copper production (Mt) 1.62 Guidance for Escondida at 1.07 Mt. Pampa Norte production is expected to increase. Guidance for Olympic Dam at 160 kt - 170 kt. Guidance for Antamina…
Key Underlying EBITDA sensitivities Approximate impact1 on FY17 Underlying EBITDA of changes of: US million US1/t on iron ore price2 217 US1/bbl on oil price3 79 US10/MMbtu on US gas price 26 US1/t on metallurgical coal price…
Debt maturity profile Debt balances1 (US billion2) 8 6 4 2 0 FY17 FY18 FY19 FY20 FY21 FY22 FY23 FY24 FY25 FY26 FY27 FY28 Post FY28 US Euro Sterling A C Bonds3 Bonds 3 Bonds 3 Bonds Bonds Subsidiaries % of portfolio 44%…
 Loading...