Third Quarter 2014 Results Paris, October 30, 2014
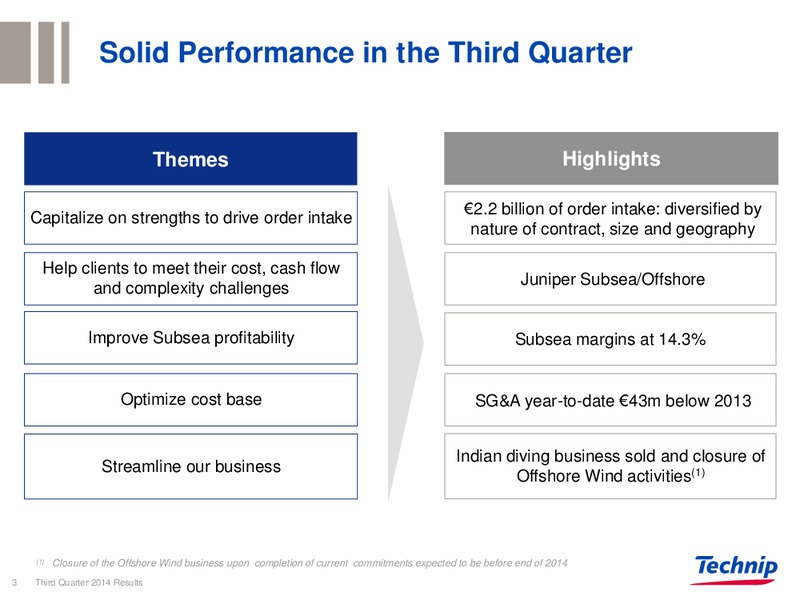
Solid Performance in the Third Quarter Themes Highlights 2.2 billion of order intake: diversified by Capitalize on strengths to drive order intake nature of contract, size and geography Help clients to meet their cost, cash…
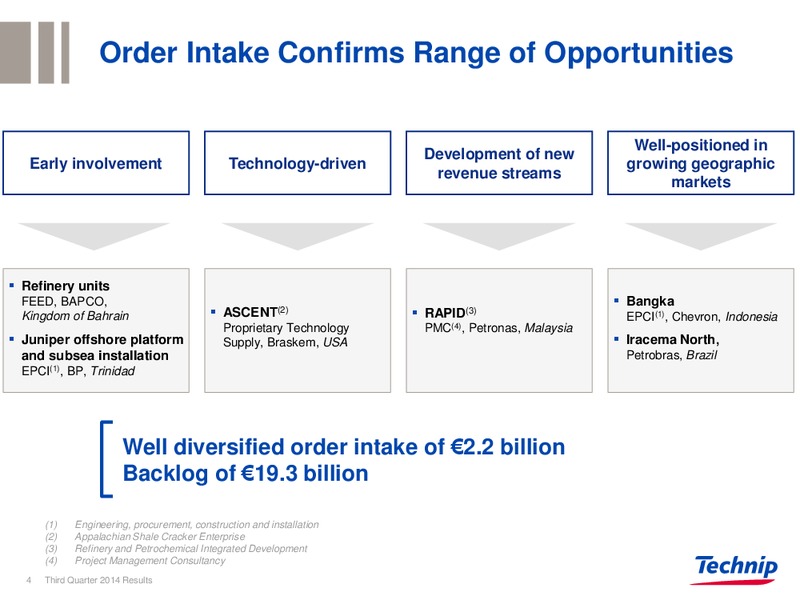
Order Intake Confirms Range of Opportunities Well-positioned in Development of new Early involvement Technology-driven growing geographic revenue streams markets Refinery units FEED, BAPCO, Bangka Kingdom of Bahrain…
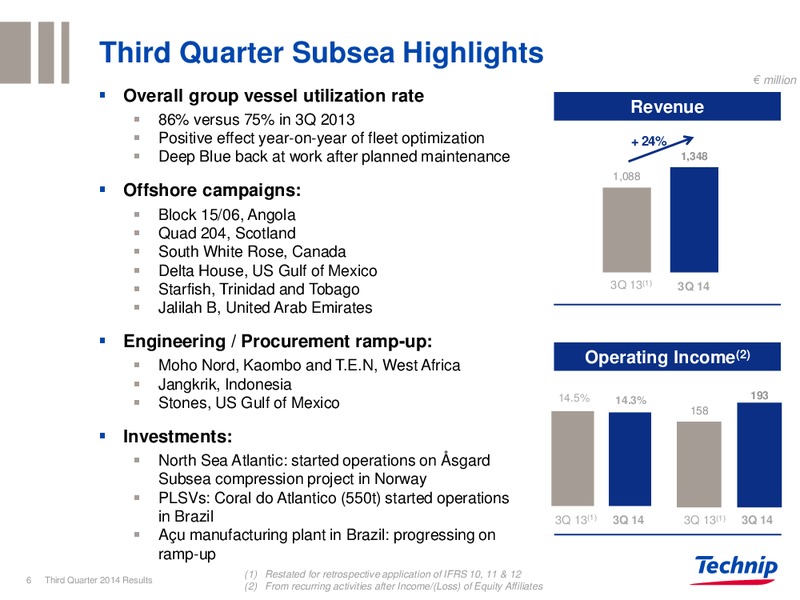
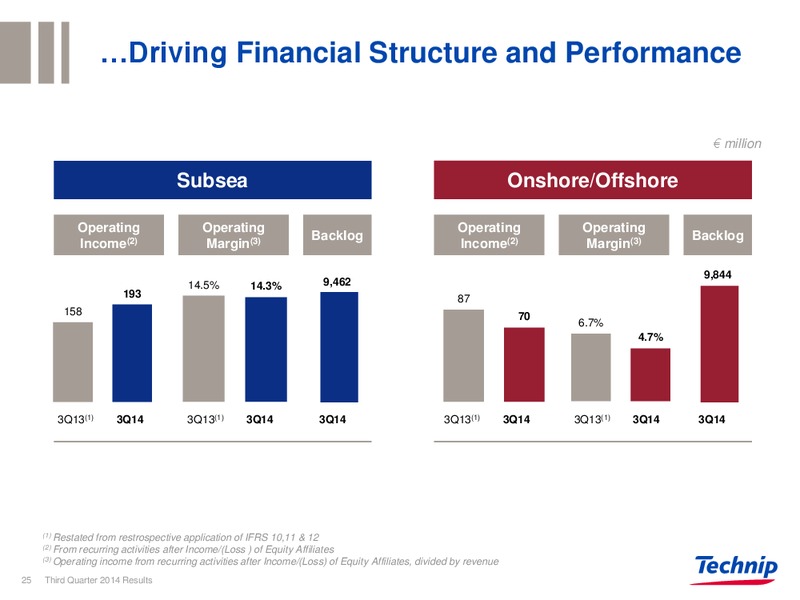
Third Quarter Subsea Highlights million Overall group vessel utilization rate Revenue 86% versus 75% in 3Q 2013 Positive effect year-on-year of fleet optimization + 24% Deep Blue back at work after planned maintenance 1,348 1,088…
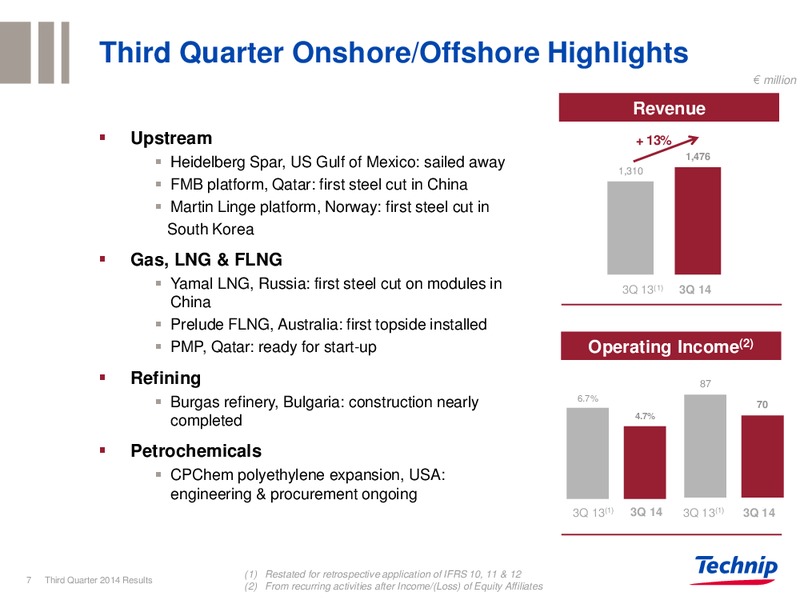
Third Quarter Onshore/Offshore Highlights million Revenue Upstream + 13% Heidelberg Spar, US Gulf of Mexico: sailed away 1,310 1,476 FMB platform, Qatar: first steel cut in China Martin Linge platform, Norway: first steel cut…
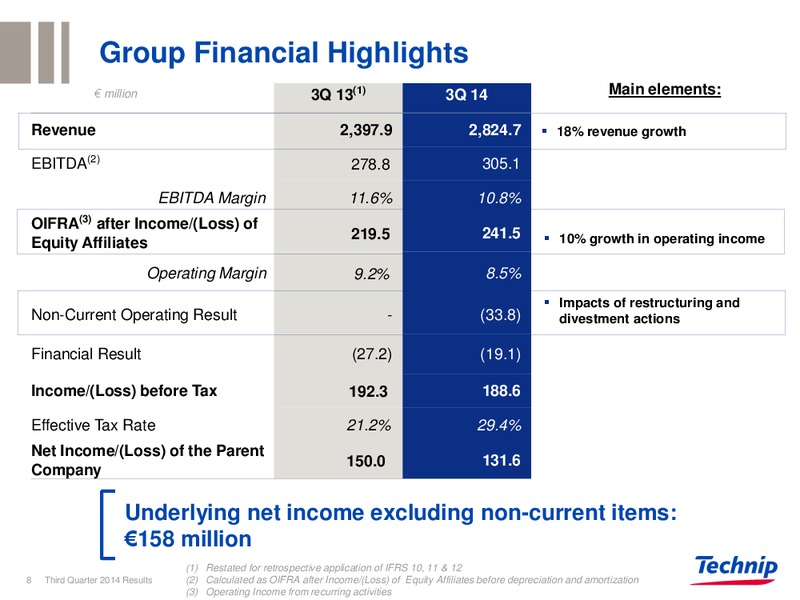
Group Financial Highlights million 3Q 13(1) 3Q 14 Main elements: Revenue 2,397.9 2,824.7 18% revenue growth EBITDA(2) 278.8 305.1 EBITDA Margin 11.6% 10.8% OIFRA(3) after Income/(Loss) of 219.5 241.5 10% growth in operating income…
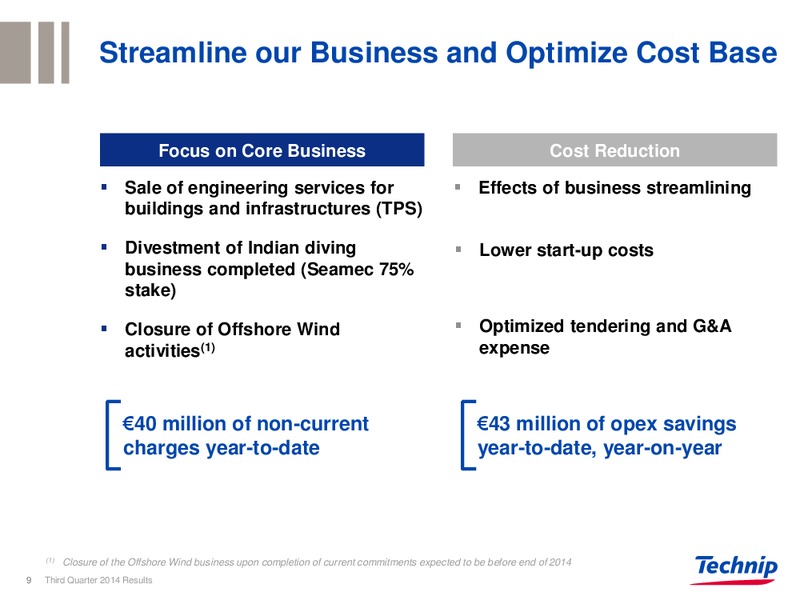
Streamline our Business and Optimize Cost Base Focus on Core Business Cost Reduction Sale of engineering services for Effects of business streamlining buildings and infrastructures (TPS) Divestment of Indian diving Lower start-up…
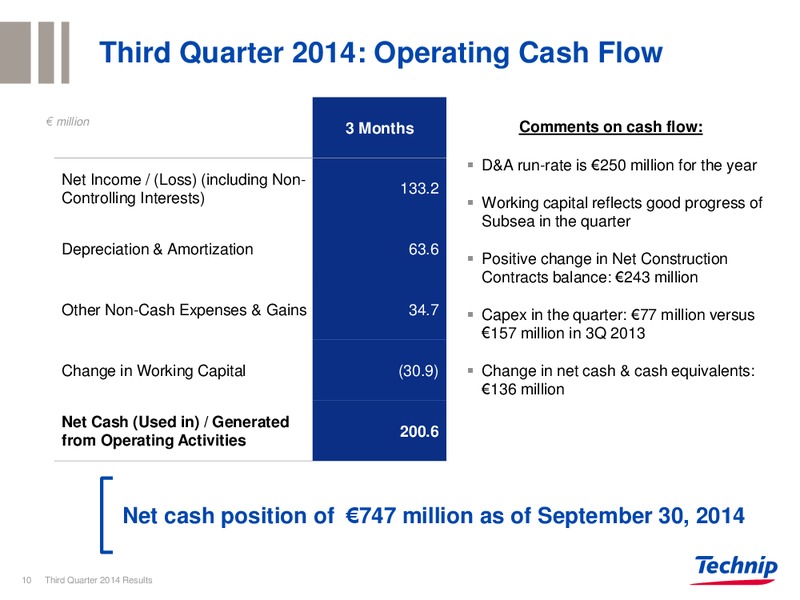
Third Quarter 2014: Operating Cash Flow million (audited) 3 Months Comments on cash flow: D&A run-rate is 250 million for the year Net Income / (Loss) (including Non- 133.2 Controlling Interests) Working capital reflects good…
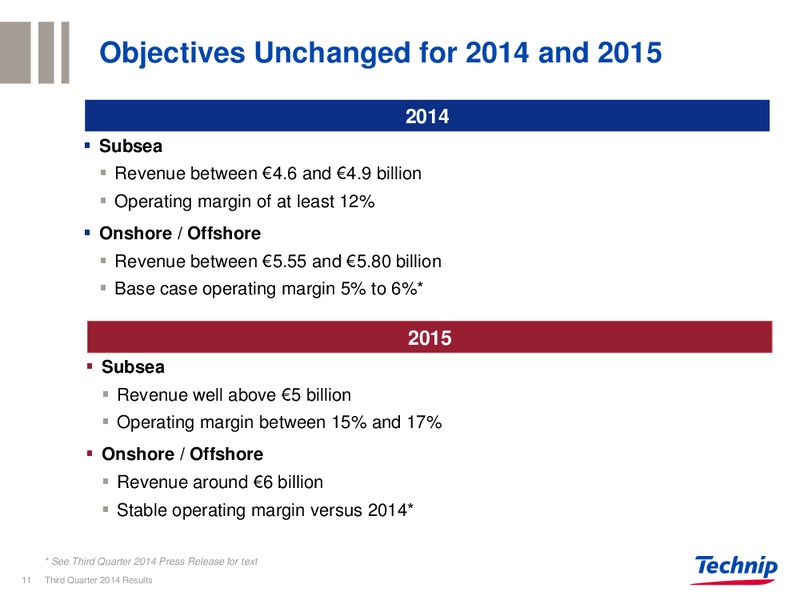
Objectives Unchanged for 2014 and 2015 2014 Subsea Revenue between 4.6 and 4.9 billion Operating margin of at least 12% Onshore / Offshore Revenue between 5.55 and 5.80 billion Base case operating margin 5% to 6%* 2015 Subsea…
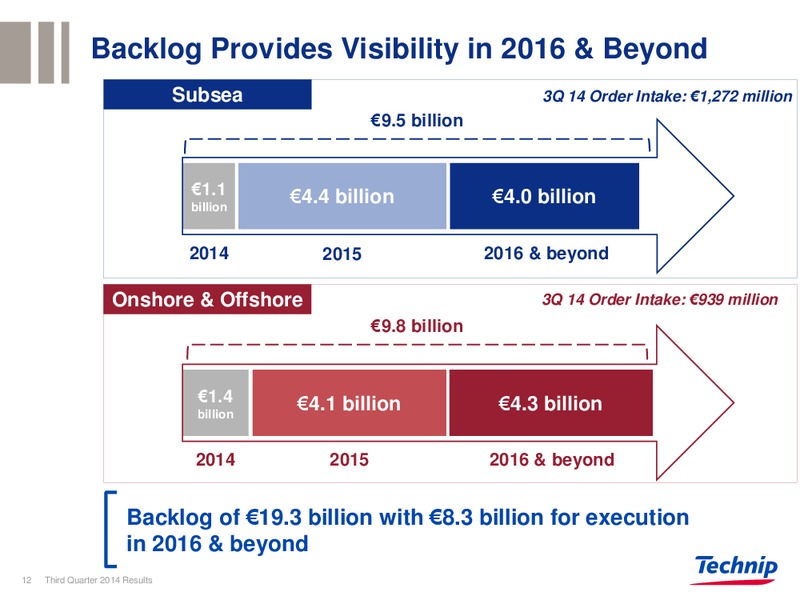
Backlog Provides Visibility in 2016 & Beyond Subsea 3Q 14 Order Intake: 1,272 million 9.5 billion 1.1 4.4 billion 4.0 billion billion 2014 2015 2016 & beyond Onshore & Offshore 3Q 14 Order Intake: 939 million 9.8 billion…
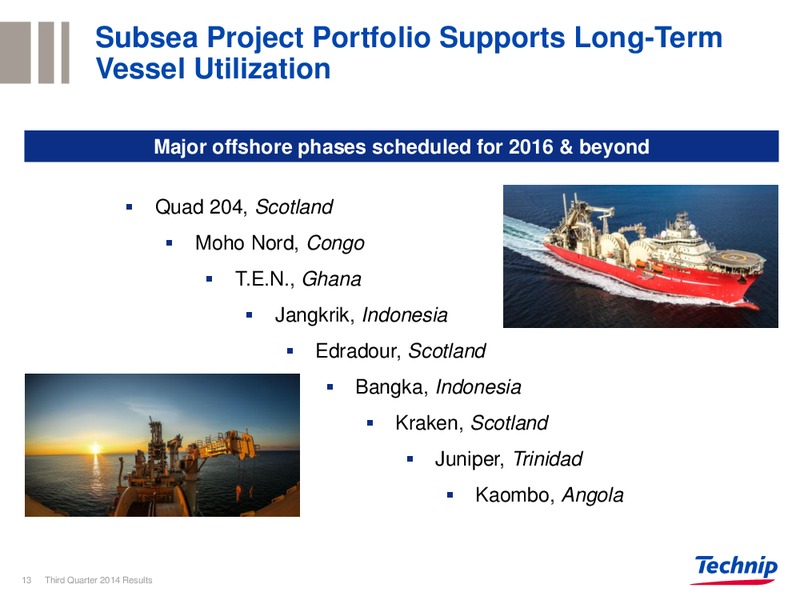
Subsea Project Portfolio Supports Long-Term Vessel Utilization Major offshore phases scheduled for 2016 & beyond Quad 204, Scotland Moho Nord, Congo T.E.N., Ghana Jangkrik, Indonesia Edradour, Scotland Bangka, Indonesia…
Seizing Opportunities from Current Market Trends 14 Third Quarter 2014 Results
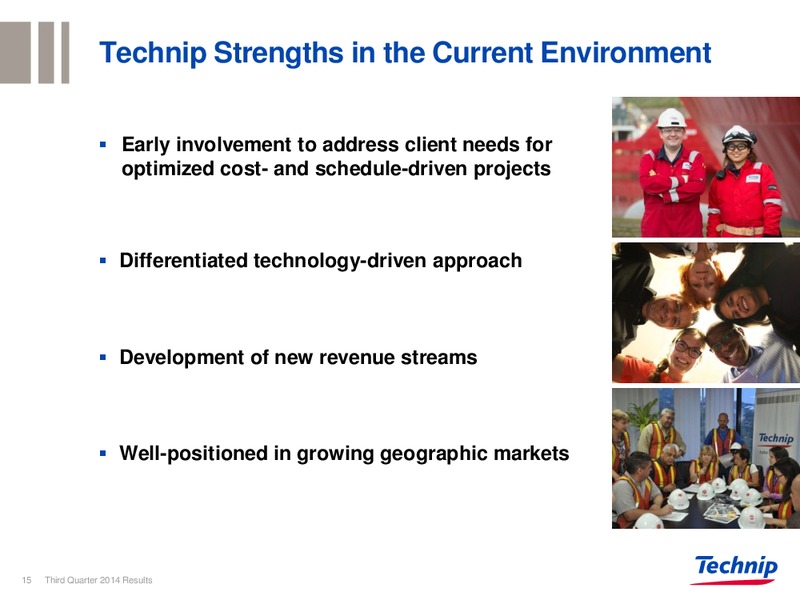
Technip Strengths in the Current Environment Early involvement to address client needs for optimized cost- and schedule-driven projects Differentiated technology-driven approach Development of new revenue streams…
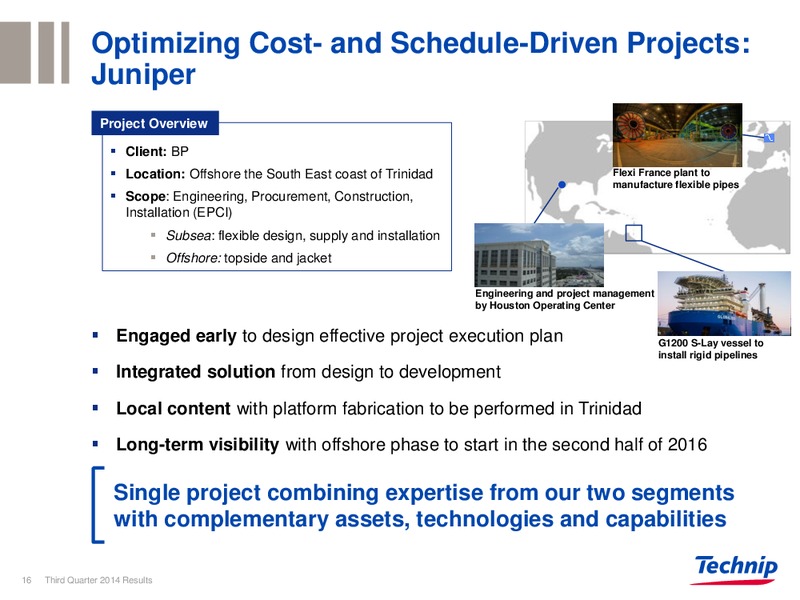
Optimizing Cost- and Schedule-Driven Projects: Juniper Project Overview Client: BP Location: Offshore the South East coast of Trinidad Flexi France plant to manufacture flexible pipes Scope: Engineering, Procurement,…
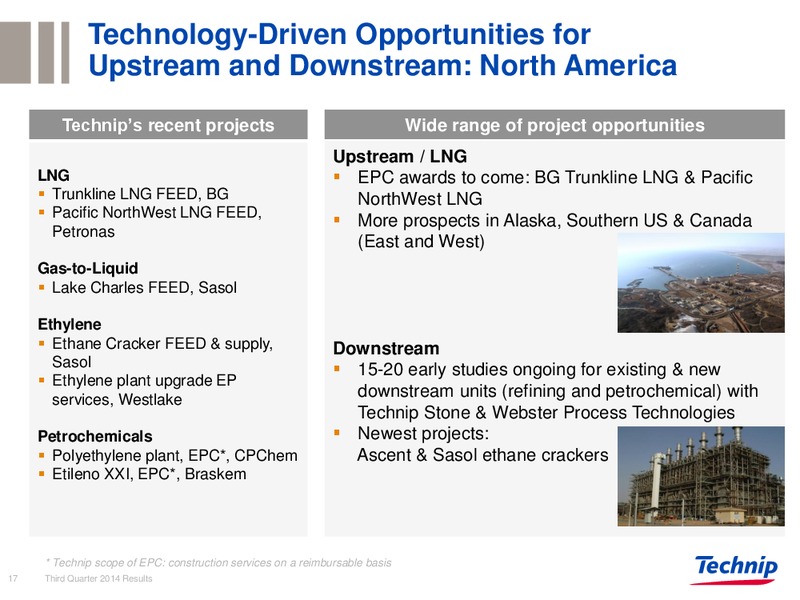
Technology-Driven Opportunities for Upstream and Downstream: North America Technips recent projects Wide range of project opportunities Upstream / LNG LNG EPC awards to come: BG Trunkline LNG & Pacific Trunkline LNG FEED, BG…
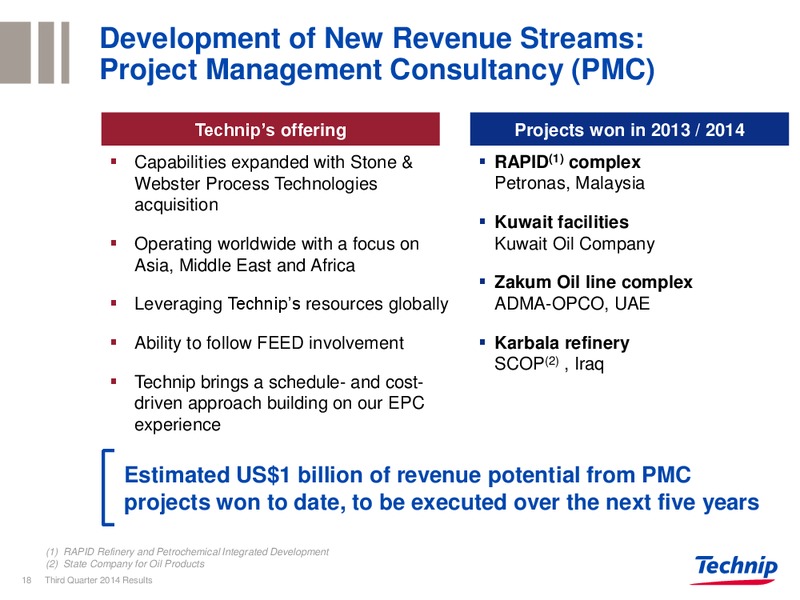
Development of New Revenue Streams: Project Management Consultancy (PMC) Technips offering Projects won in 2013 / 2014 Capabilities expanded with Stone & RAPID(1) complex Webster Process Technologies Petronas, Malaysia acquisition…
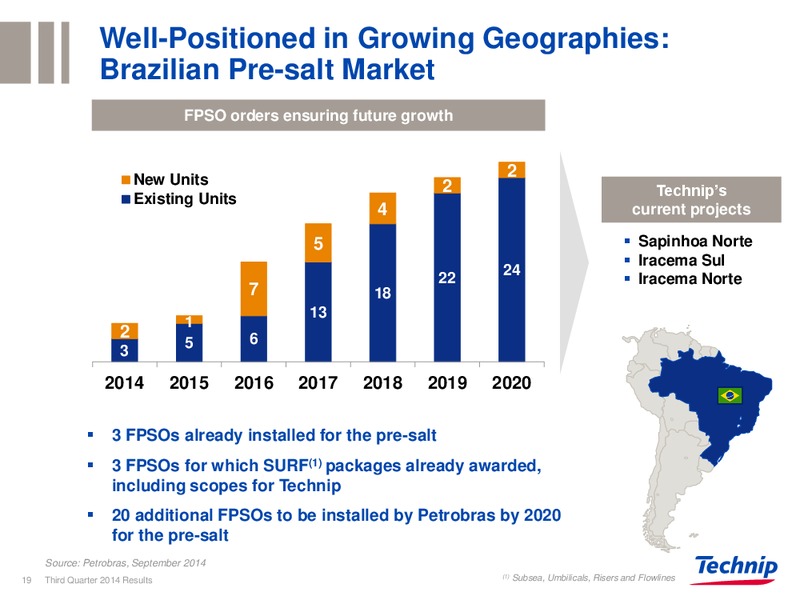
Well-Positioned in Growing Geographies: Brazilian Pre-salt Market FPSO orders ensuring future growth New Units 2 2 Technips Existing Units 4 current projects 5 Sapinhoa Norte Iracema Sul 24 22 Iracema Norte 7 18 13 1 2…
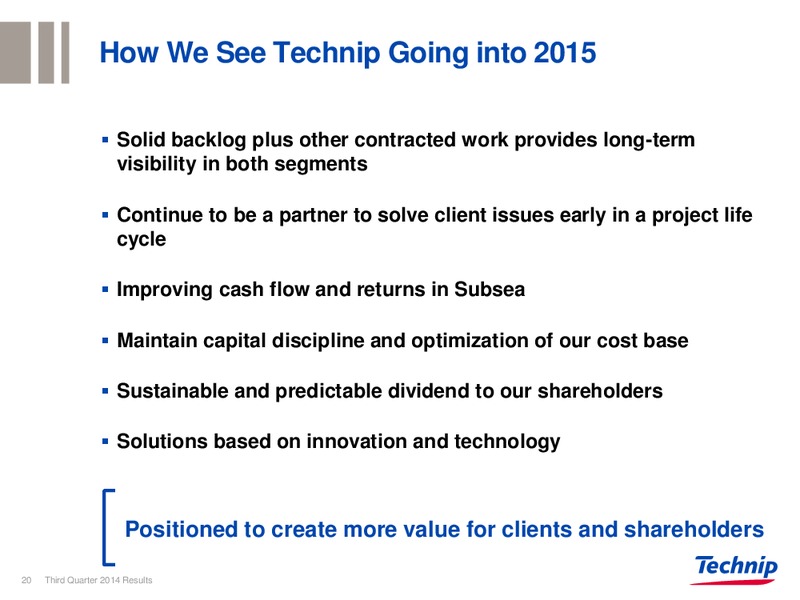
How We See Technip Going into 2015 Solid backlog plus other contracted work provides long-term visibility in both segments Continue to be a partner to solve client issues early in a project life cycle Improving cash flow and…
Annex
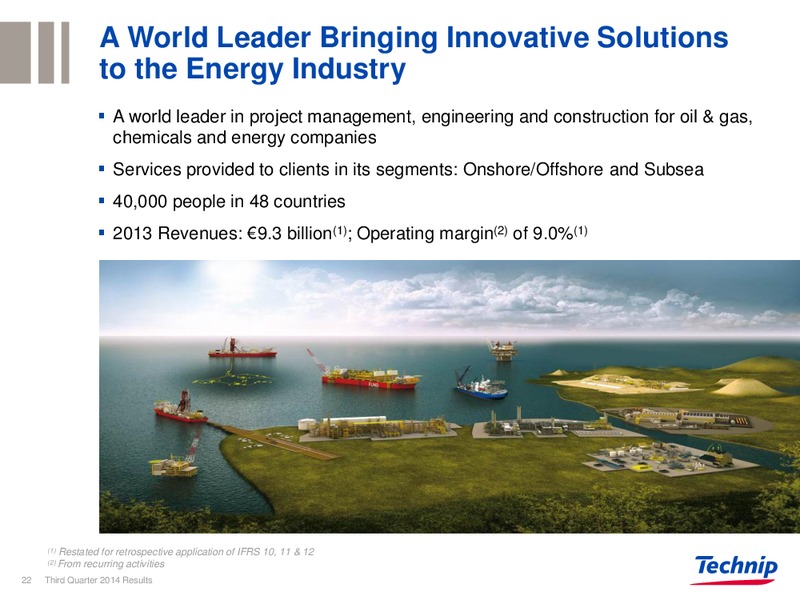
A World Leader Bringing Innovative Solutions to the Energy Industry A world leader in project management, engineering and construction for oil & gas, chemicals and energy companies Services provided to clients in its segments:…
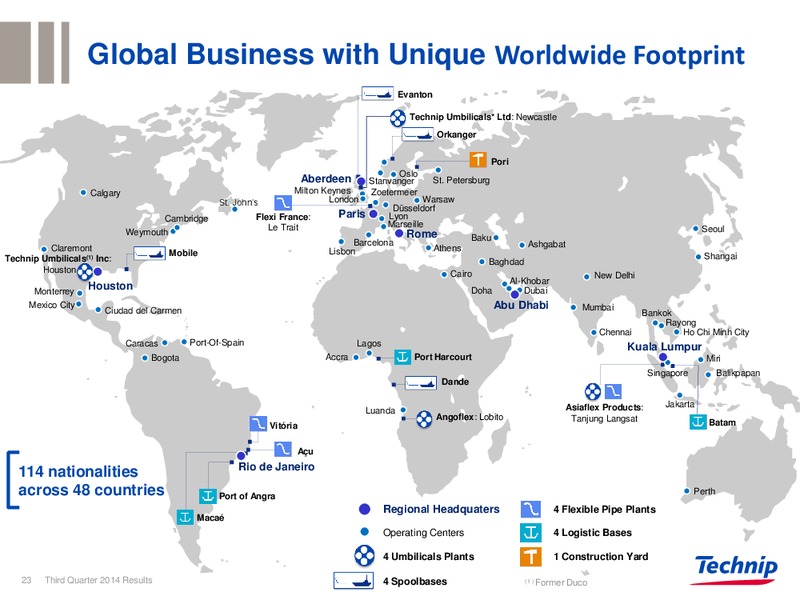
Global Business with Unique Worldwide Footprint Evanton Technip Umbilicals* Ltd: Newcastle Orkanger Pori Oslo Aberdeen Stanvanger St. Petersburg Calgary Milton Keynes Zoetermeer St. Johns London Warsaw Dsseldorf Cambridge…
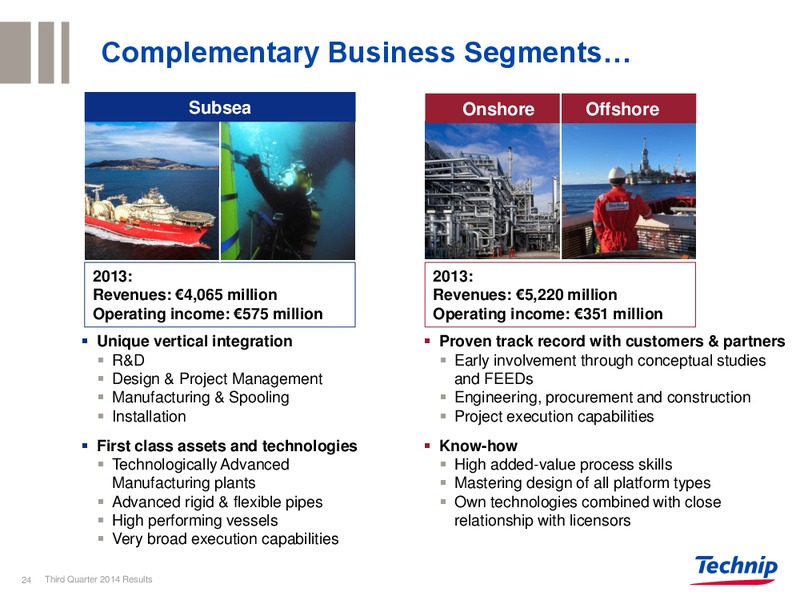
Complementary Business Segments Subsea Onshore Offshore 2013: 2013: Revenues: 4,065 million Revenues: 5,220 million Operating income: 575 million Operating income: 351 million Unique vertical integration Proven track record with…
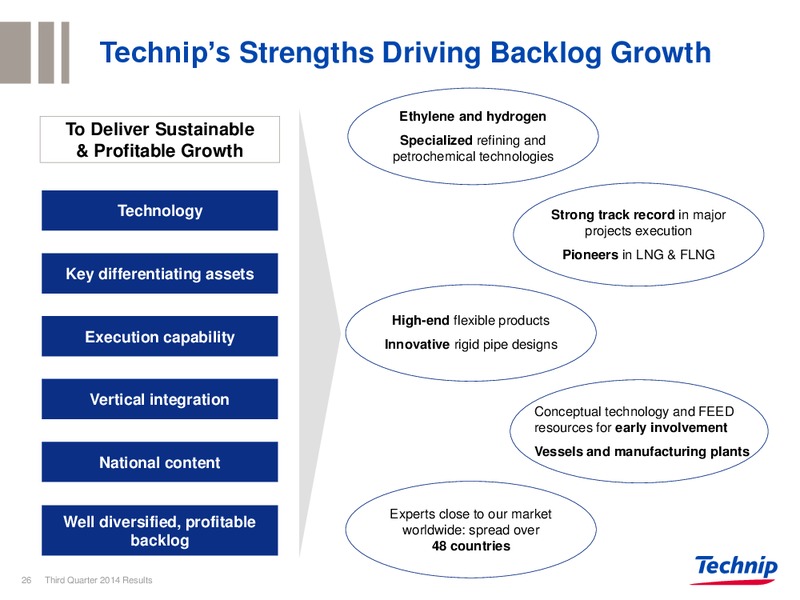
Technips Strengths Driving Backlog Growth Ethylene and hydrogen To Deliver Sustainable Specialized refining and & Profitable Growth petrochemical technologies Technology Strong track record in major projects execution Pioneers…
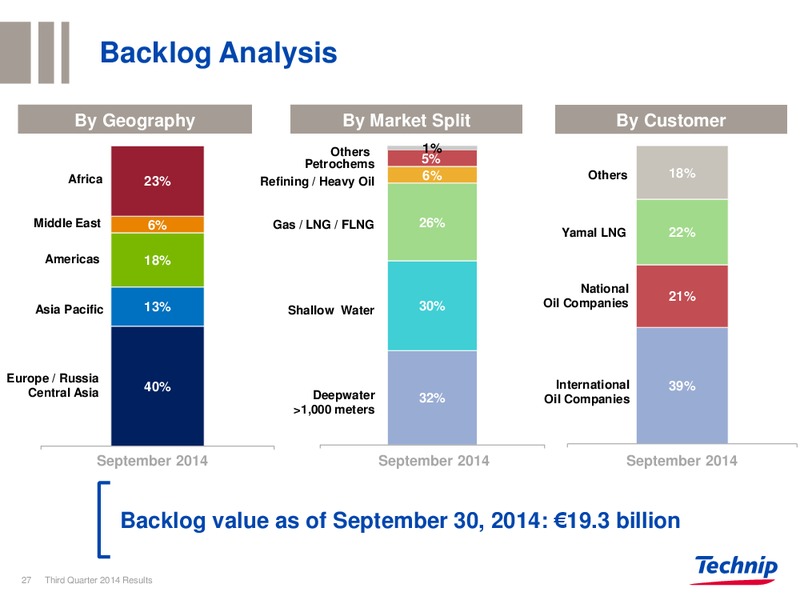
Backlog Analysis By Geography By Market Split By Customer Others 1% Petrochems 5% Africa 6% Others 18% 23% Refining / Heavy Oil Middle East 6% Gas / LNG / FLNG 26% Yamal LNG 22% Americas 18% National Oil Companies 21% Asia…
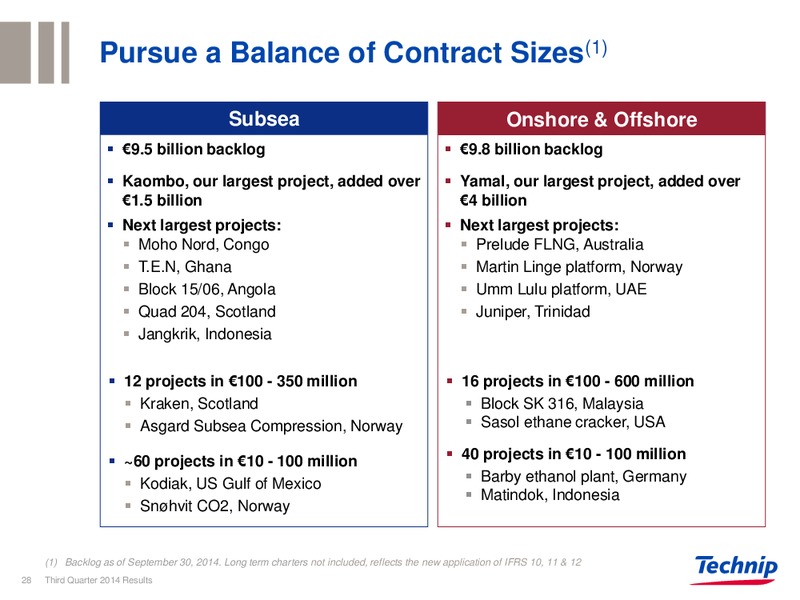
Pursue a Balance of Contract Sizes(1) Subsea Onshore & Offshore 9.5 billion backlog 9.8 billion backlog Kaombo, our largest project, added over Yamal, our largest project, added over 1.5 billion 4 billion Next largest projects:…
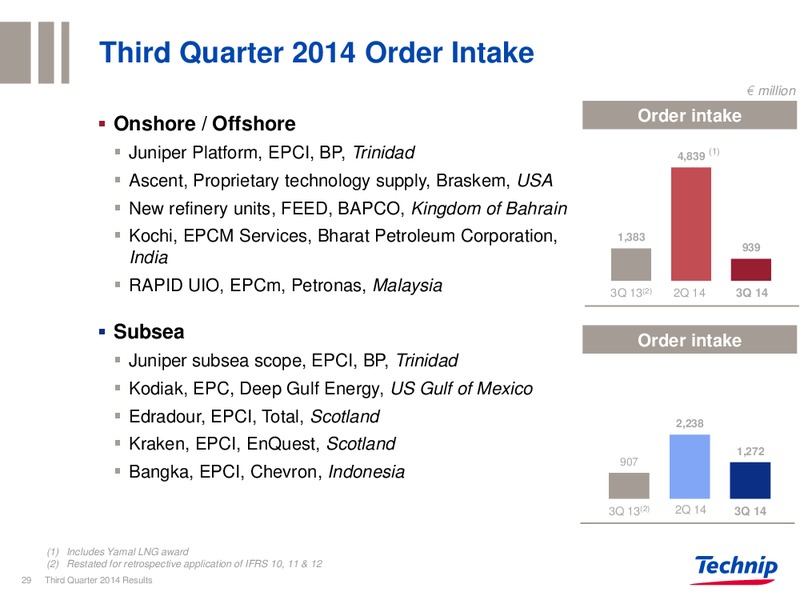
Third Quarter 2014 Order Intake million Onshore / Offshore Order intake Juniper Platform, EPCI, BP, Trinidad 4,839 (1) Ascent, Proprietary technology supply, Braskem, USA New refinery units, FEED, BAPCO, Kingdom of Bahrain…
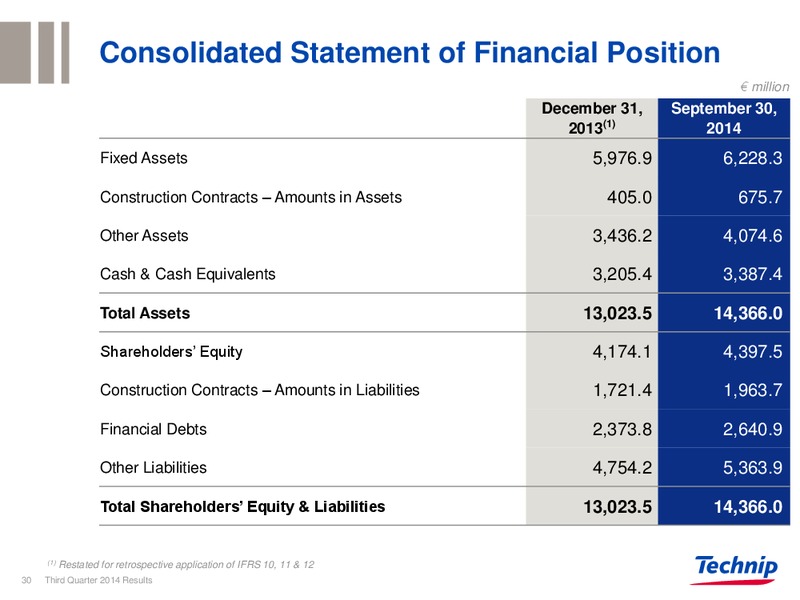
Consolidated Statement of Financial Position million December 31, September 30, 2013(1) 2014 Fixed Assets 5,976.9 6,228.3 Construction Contracts Amounts in Assets 405.0 675.7 Other Assets 3,436.2 4,074.6 Cash & Cash Equivalents…
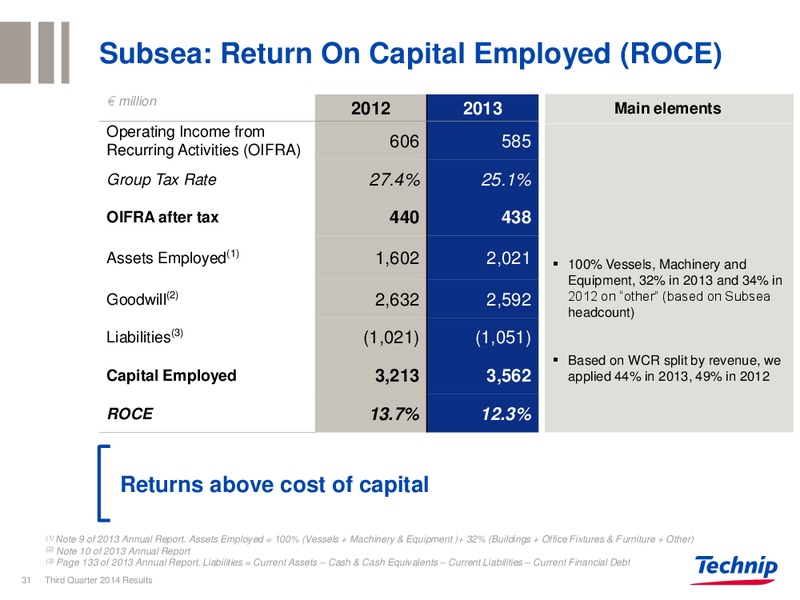
Subsea: Return On Capital Employed (ROCE) million Main elements 2012 2013 Main elements Operating Income from Recurring Activities (OIFRA) 606 585 Group Tax Rate 27.4% 25.1% OIFRA after tax 440 438 Assets Employed(1) 1,602…
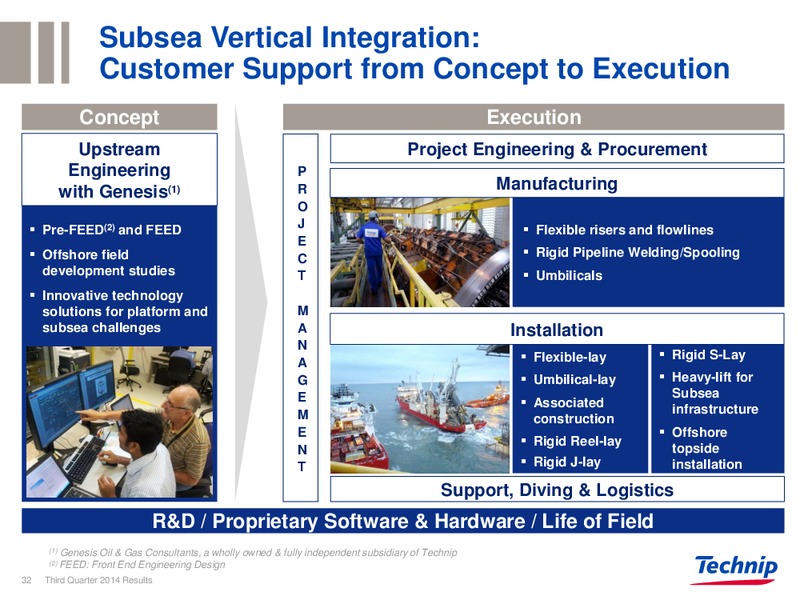
Subsea Vertical Integration: Customer Support from Concept to Execution Concept Execution Upstream Project Engineering & Procurement Engineering P with Genesis(1) R Manufacturing O Pre-FEED(2) and FEED J Flexible risers and…
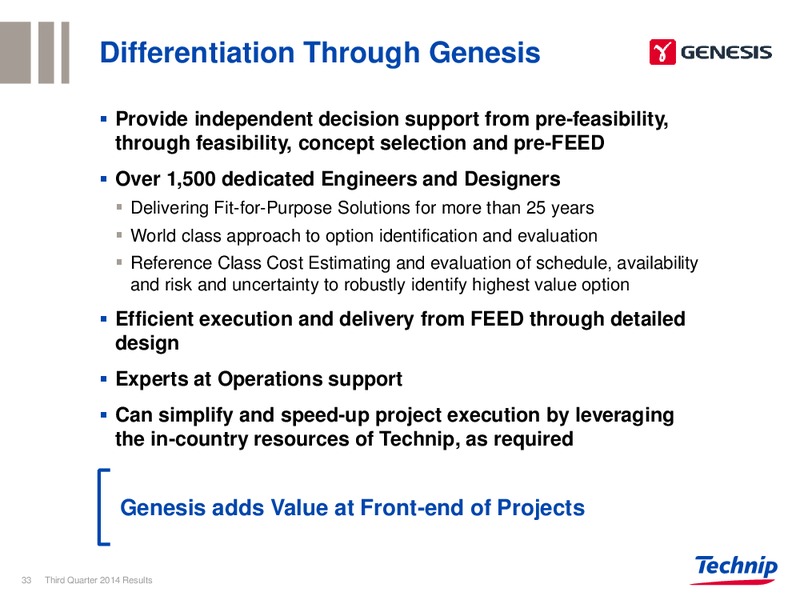
Differentiation Through Genesis Provide independent decision support from pre-feasibility, through feasibility, concept selection and pre-FEED Over 1,500 dedicated Engineers and Designers Delivering Fit-for-Purpose Solutions for…
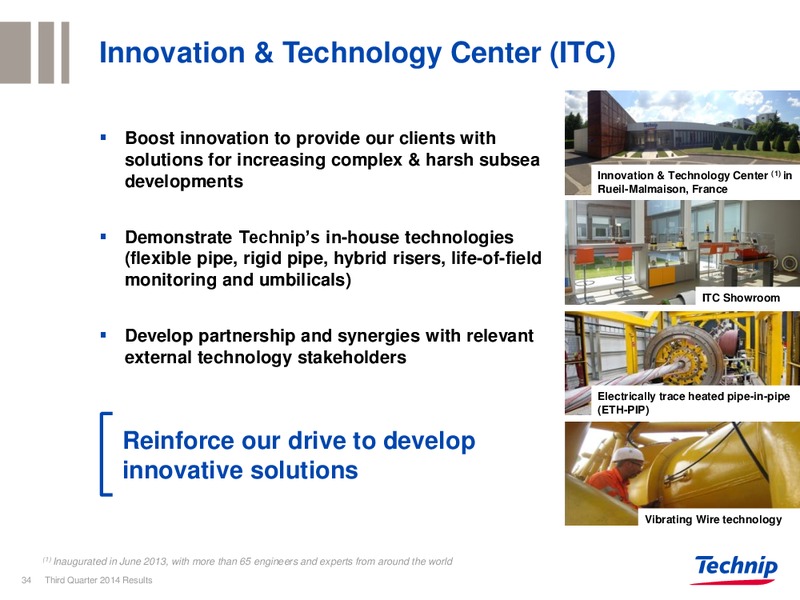
Innovation & Technology Center (ITC) Boost innovation to provide our clients with solutions for increasing complex & harsh subsea Innovation & Technology Center (1) in developments Rueil-Malmaison, France Demonstrate Technips…
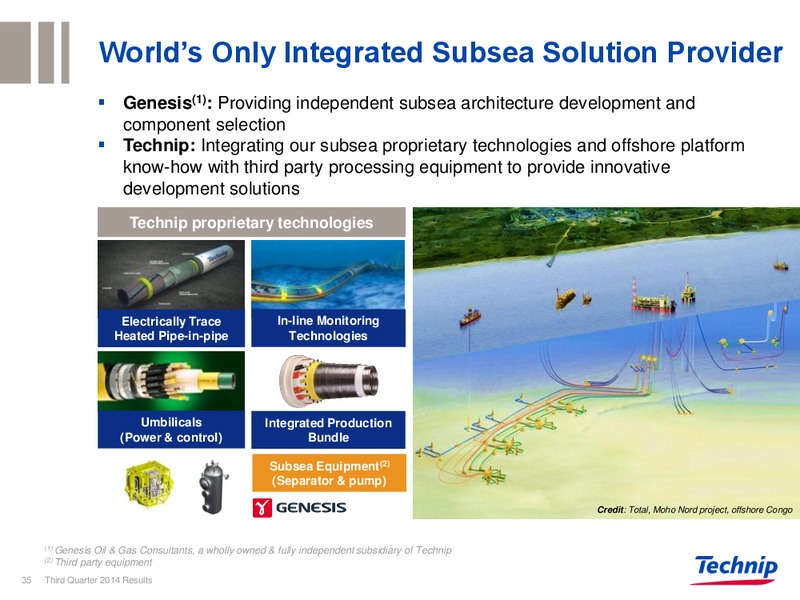
Worlds Only Integrated Subsea Solution Provider Genesis(1): Providing independent subsea architecture development and component selection Technip: Integrating our subsea proprietary technologies and offshore platform know-how with…
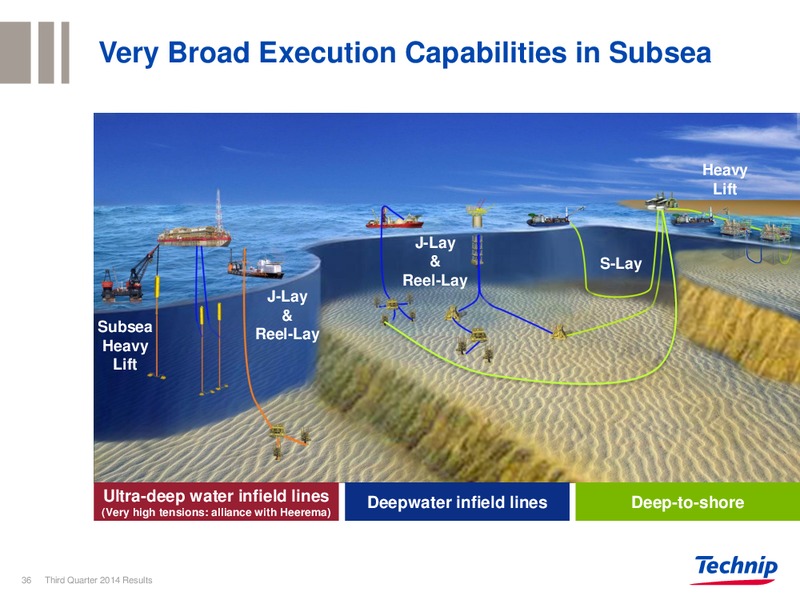
Very Broad Execution Capabilities in Subsea Heavy Lift J-Lay & S-Lay Reel-Lay J-Lay & Subsea Reel-Lay Heavy Lift Ultra-deep water infield lines Deepwater infield lines Deep-to-shore (Very high tensions: alliance with…
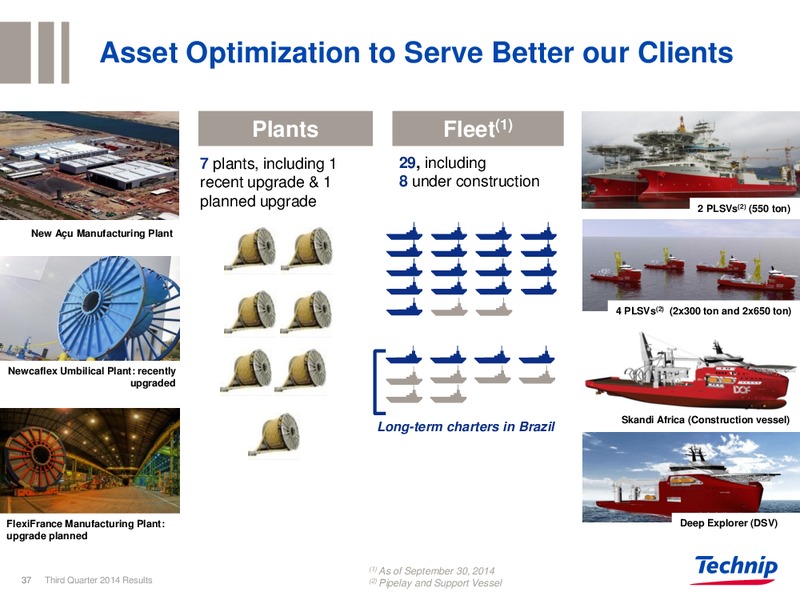
Asset Optimization to Serve Better our Clients Plants Fleet(1) 7 plants, including 1 29, including recent upgrade & 1 8 under construction planned upgrade 2 PLSVs(2) (550 ton) New Au Manufacturing Plant 4 PLSVs(2) (2x300 ton…
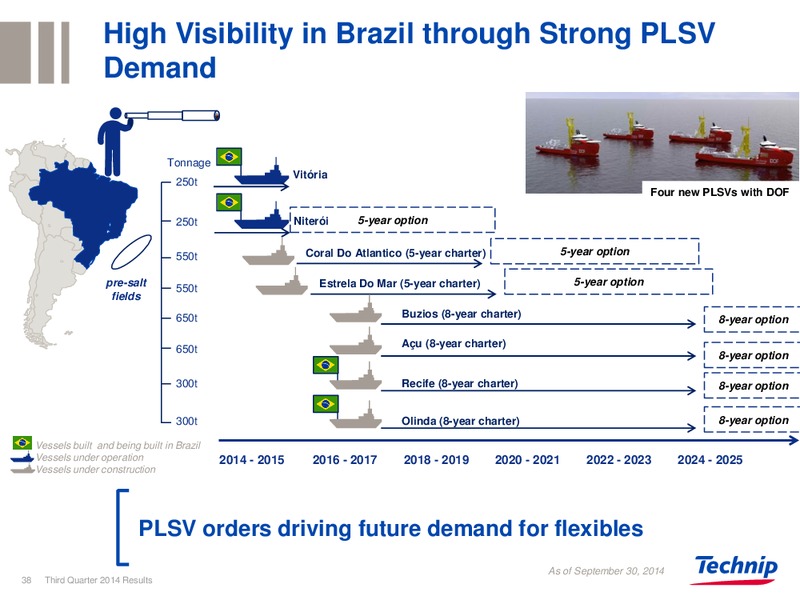
High Visibility in Brazil through Strong PLSV Demand Tonnage Vitria 250t Four new PLSVs with DOF 250t Niteri 5-year option 550t Coral Do Atlantico (5-year charter) 5-year option pre-salt Estrela Do Mar (5-year charter)…
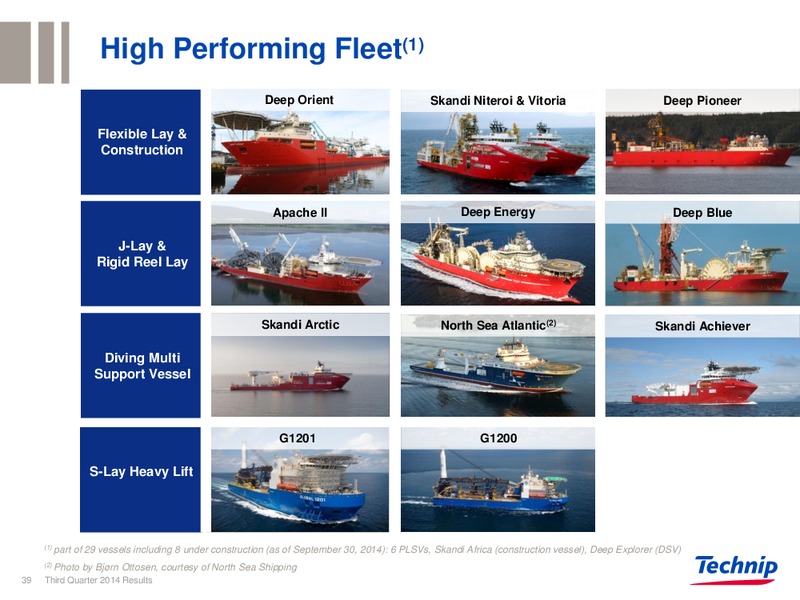
High Performing Fleet(1) Deep Orient Skandi Niteroi & Vitoria Deep Pioneer Flexible Lay & Construction Apache II Deep Energy Deep Blue J-Lay & Rigid Reel Lay Skandi Arctic North Sea Atlantic(2) Skandi Achiever Diving…
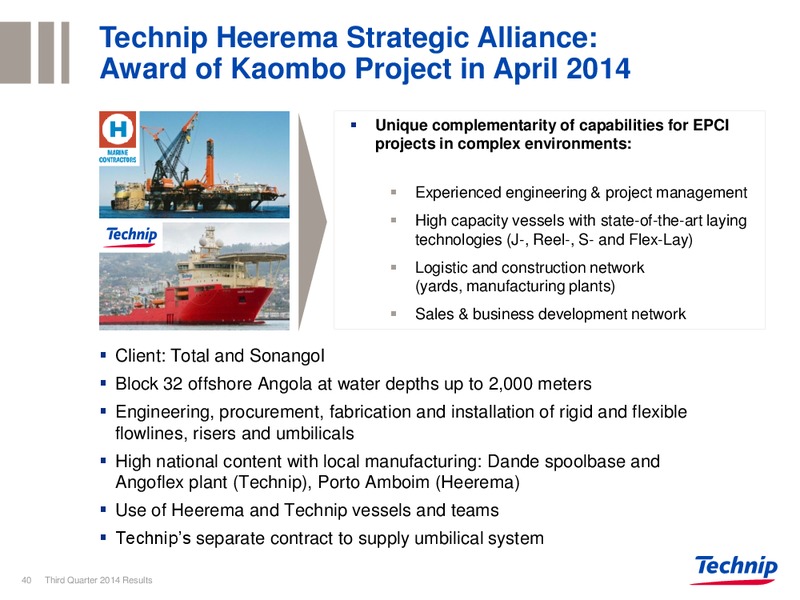
Technip Heerema Strategic Alliance: Award of Kaombo Project in April 2014 Unique complementarity of capabilities for EPCI projects in complex environments: Experienced engineering & project management High capacity vessels with…
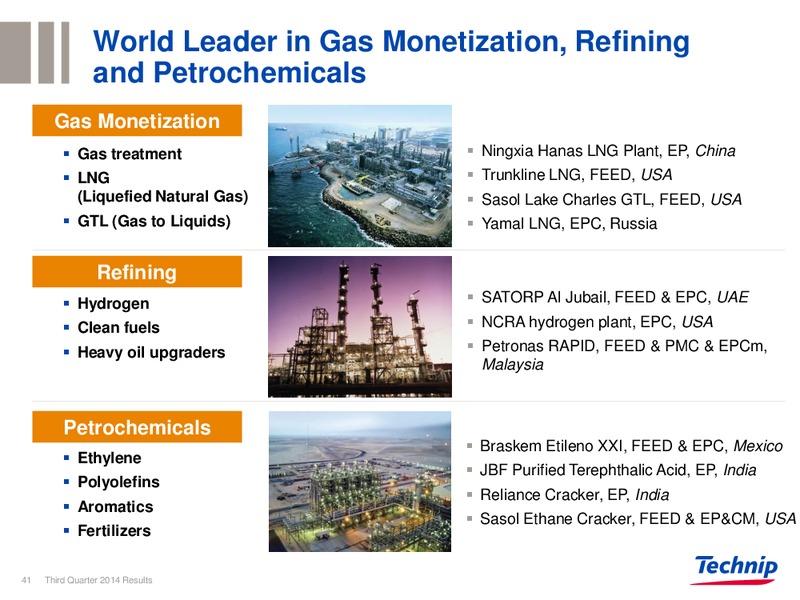
World Leader in Gas Monetization, Refining and Petrochemicals Gas Monetization Gas treatment Ningxia Hanas LNG Plant, EP, China LNG Trunkline LNG, FEED, USA (Liquefied Natural Gas) Sasol Lake Charles GTL, FEED, USA GTL (Gas to…
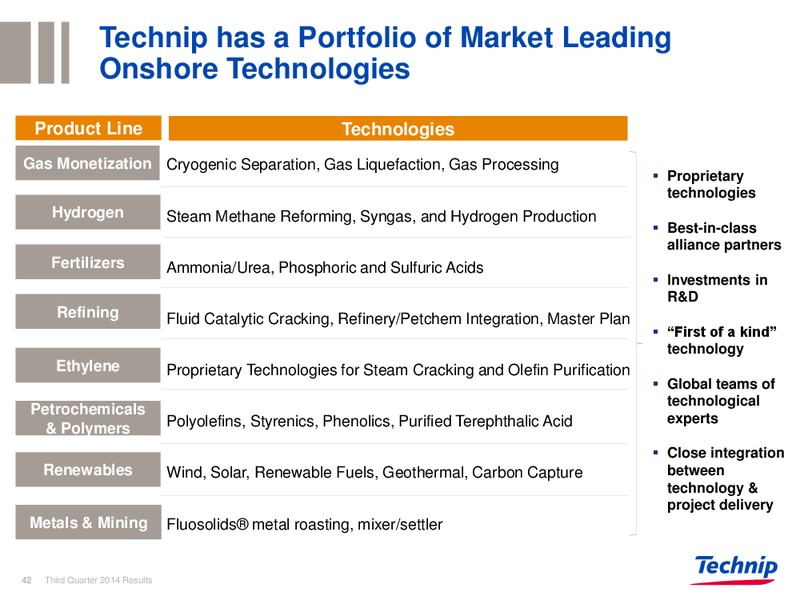
Technip has a Portfolio of Market Leading Onshore Technologies Product Line Technologies Gas Monetization Cryogenic Separation, Gas Liquefaction, Gas Processing Proprietary technologies Hydrogen Steam Methane Reforming, Syngas, and…
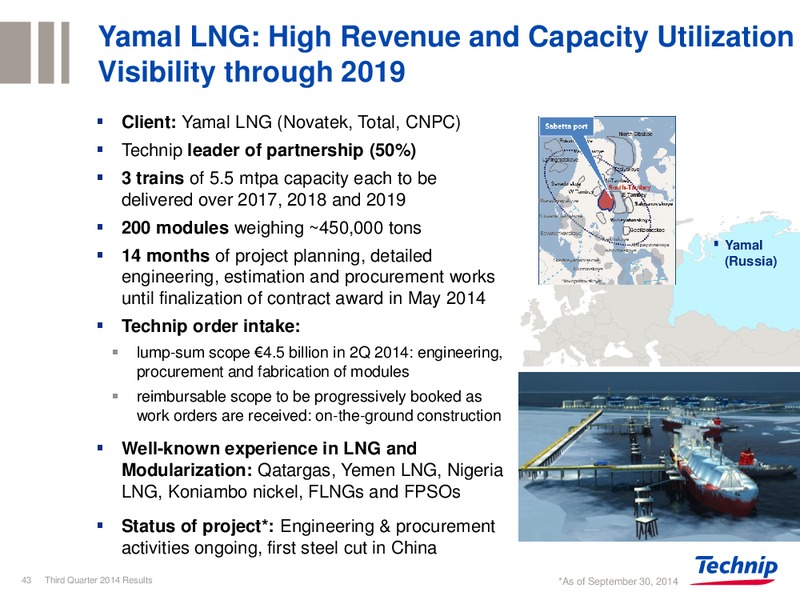
Yamal LNG: High Revenue and Capacity Utilization Visibility through 2019 Client: Yamal LNG (Novatek, Total, CNPC) Technip leader of partnership (50%) 3 trains of 5.5 mtpa capacity each to be delivered over 2017, 2018 and 2019 200…
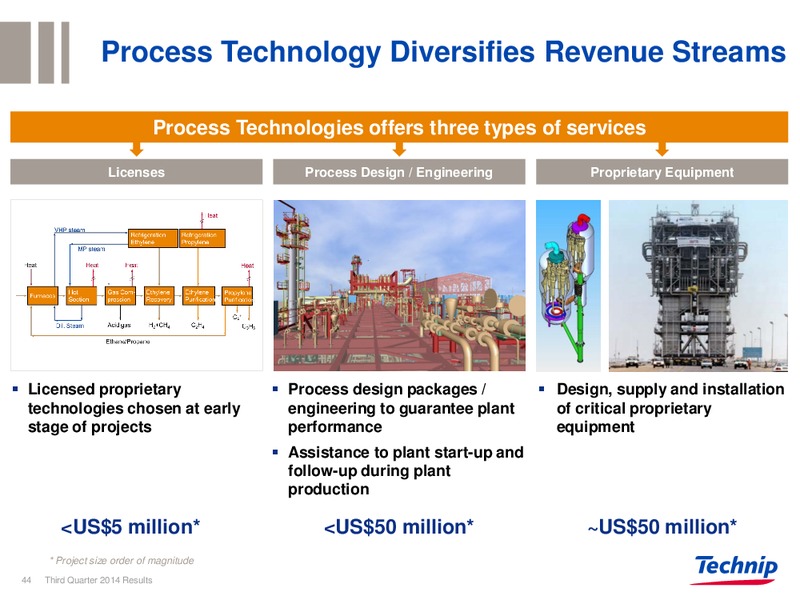
Process Technology Diversifies Revenue Streams Process Technologies offers three types of services Licenses Process Design / Engineering Proprietary Equipment Licensed proprietary Process design packages / Design, supply and…
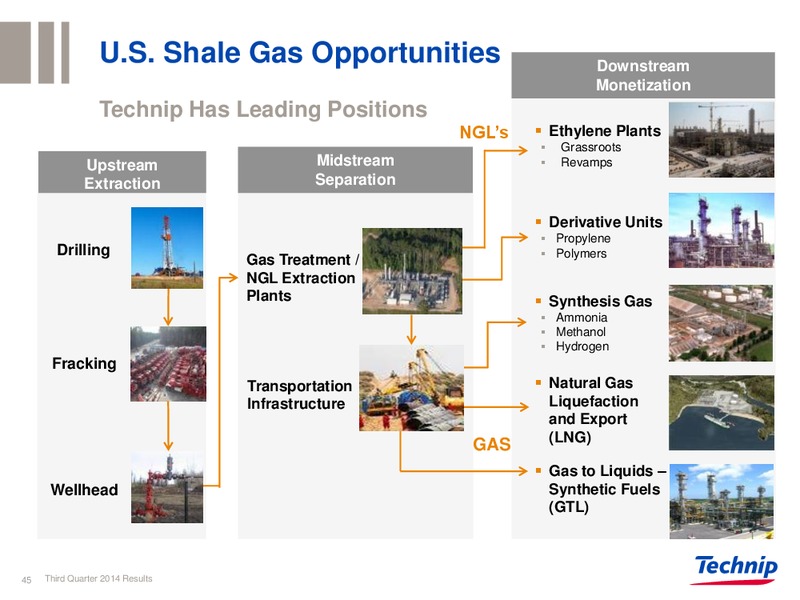
U.S. Shale Gas Opportunities Downstream Monetization Technip Has Leading Positions NGLs Ethylene Plants Grassroots Upstream Midstream Revamps Extraction Separation Derivative Units Propylene Drilling Polymers Gas Treatment /…
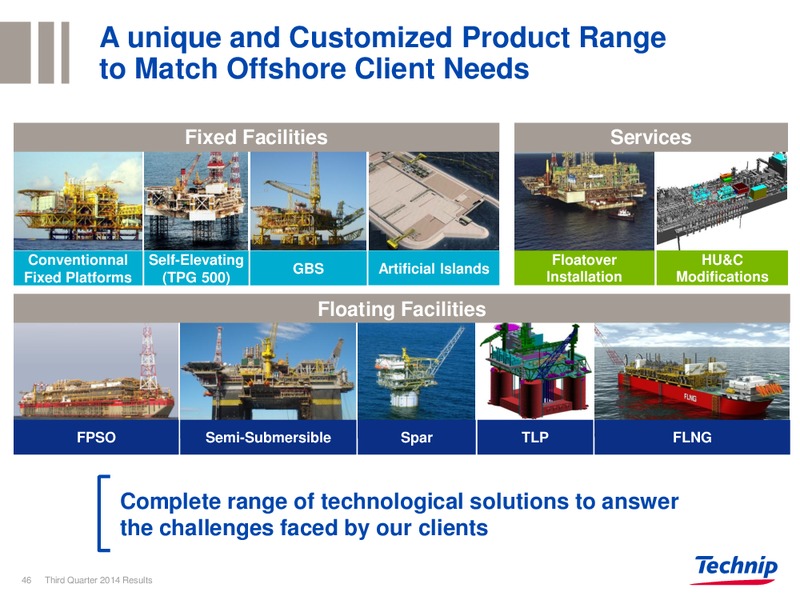
A unique and Customized Product Range to Match Offshore Client Needs Fixed Facilities Services Conventionnal Self-Elevating Floatover HU&C GBS Artificial Islands Fixed Platforms (TPG 500) Installation Modifications Floating…
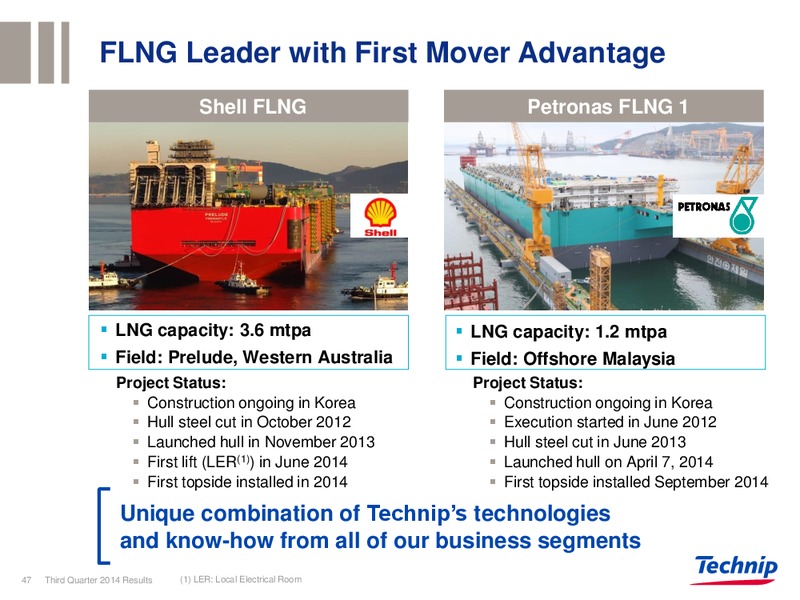
FLNG Leader with First Mover Advantage Shell FLNG Petronas FLNG 1 LNG capacity: 3.6 mtpa LNG capacity: 1.2 mtpa Field: Prelude, Western Australia Field: Offshore Malaysia Project Status: Project Status: Construction ongoing in…
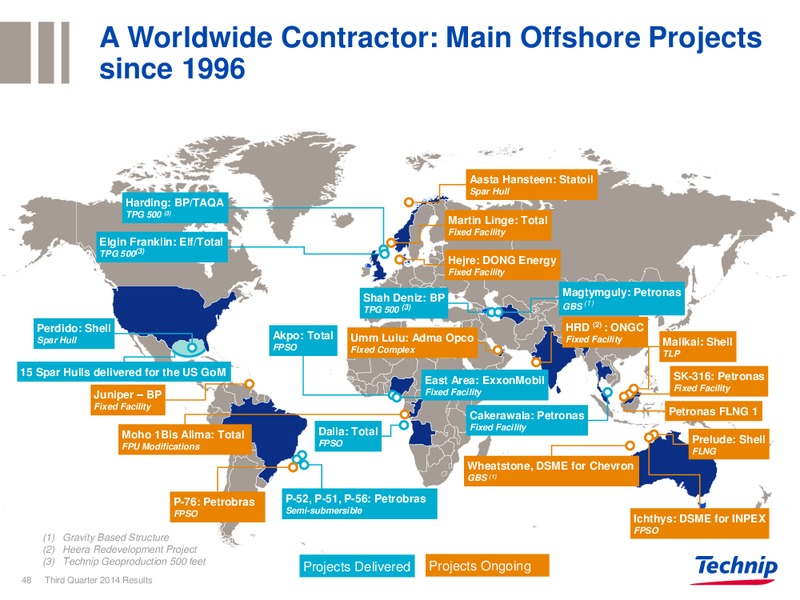
A Worldwide Contractor: Main Offshore Projects since 1996 Aasta Hansteen: Statoil Spar Hull Harding: BP/TAQA TPG 500 (3) Martin Linge: Total Fixed Facility Elgin Franklin: Elf/Total TPG 500(3) Hejre: DONG Energy Fixed…
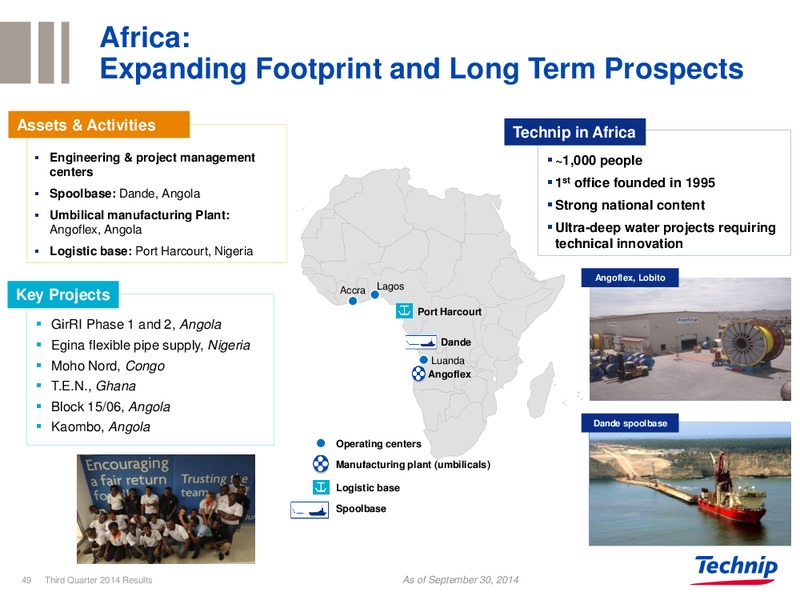
Africa: Expanding Footprint and Long Term Prospects Assets & Activities Technip in Africa Engineering & project management 1,000 people centers 1st office founded in 1995 Spoolbase: Dande, Angola Strong national content Umbilical…
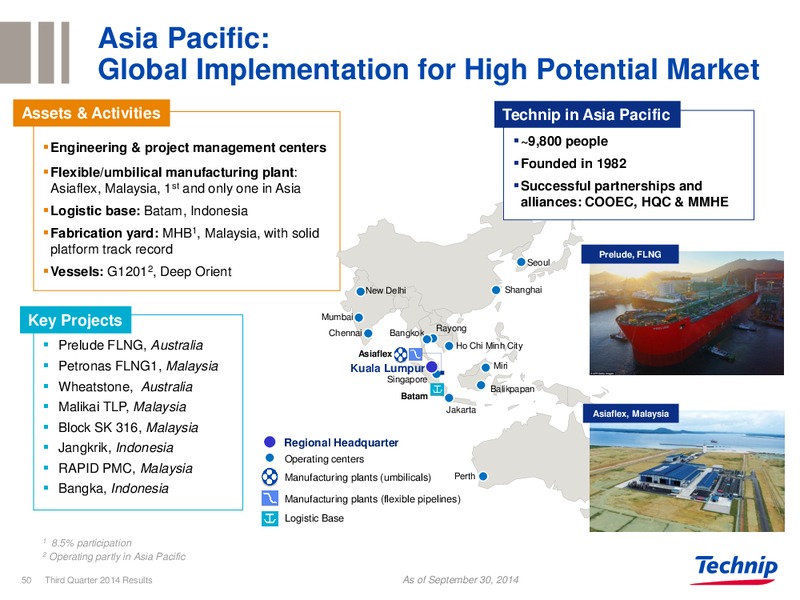
Asia Pacific: Global Implementation for High Potential Market Assets & Activities Technip in Asia Pacific Engineering & project management centers 9,800 people Founded in 1982 Flexible/umbilical manufacturing plant: Asiaflex,…
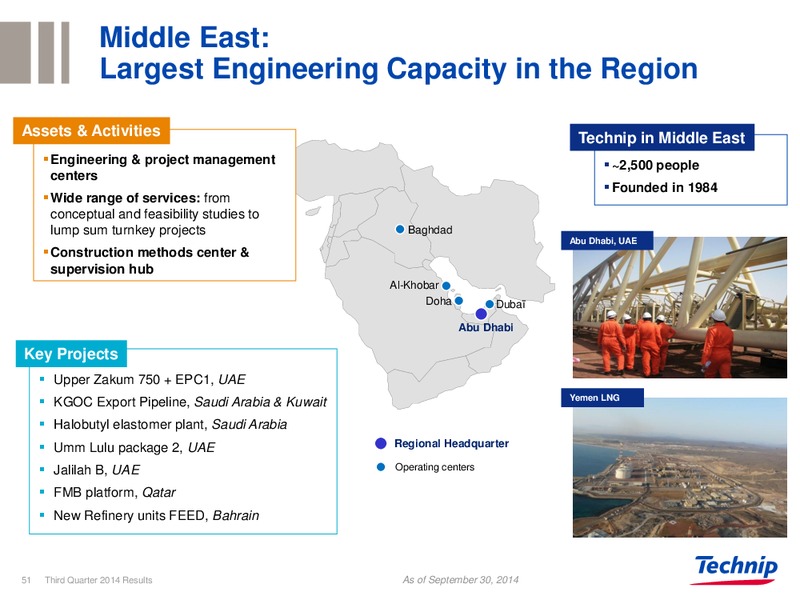
Middle East: Largest Engineering Capacity in the Region Assets & Activities Technip in Middle East Engineering & project management 2,500 people centers Founded in 1984 Wide range of services: from conceptual and feasibility…
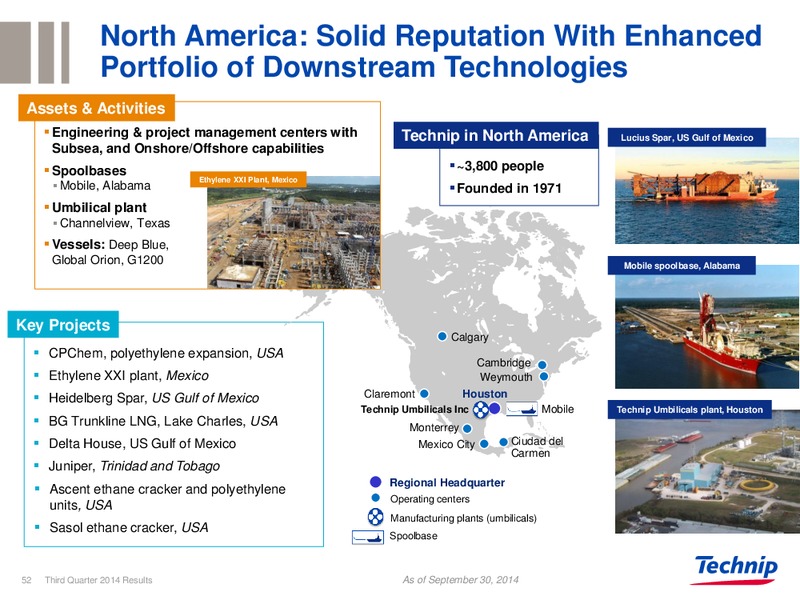
North America: Solid Reputation With Enhanced Portfolio of Downstream Technologies Assets & Activities Engineering & project management centers with Technip in North America Lucius Spar, US Gulf of Mexico Subsea, and Onshore/Offshore…
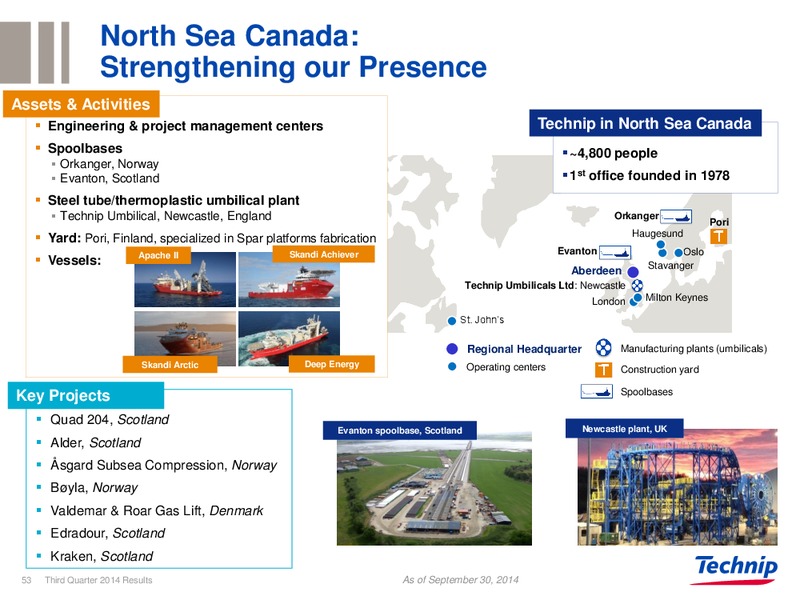
North Sea Canada: Strengthening our Presence Assets & Activities Engineering & project management centers Technip in North Sea Canada Spoolbases 4,800 people Orkanger, Norway Evanton, Scotland 1st office founded in 1978 Steel…
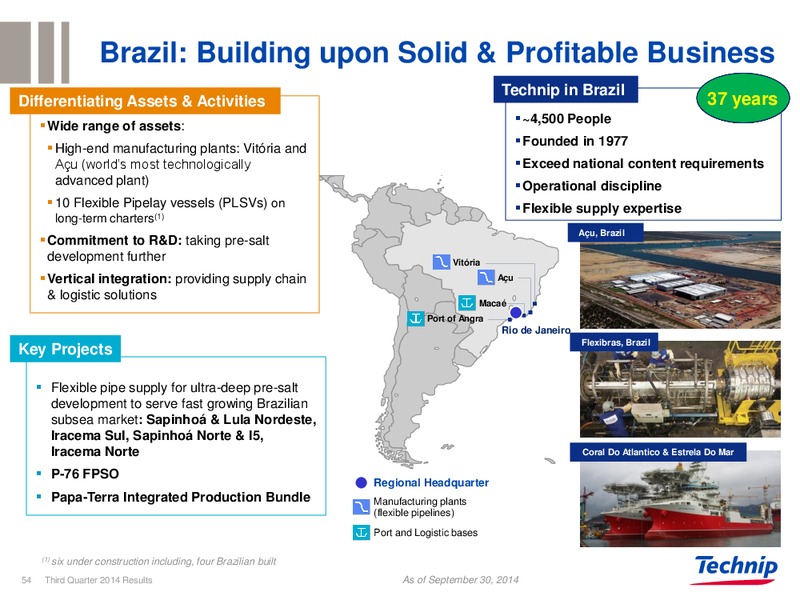
Brazil: Building upon Solid & Profitable Business Technip in Brazil Differentiating Assets & Activities 37 years 4,500 People Wide range of assets: Founded in 1977 High-end manufacturing plants: Vitria and Au (worlds most…
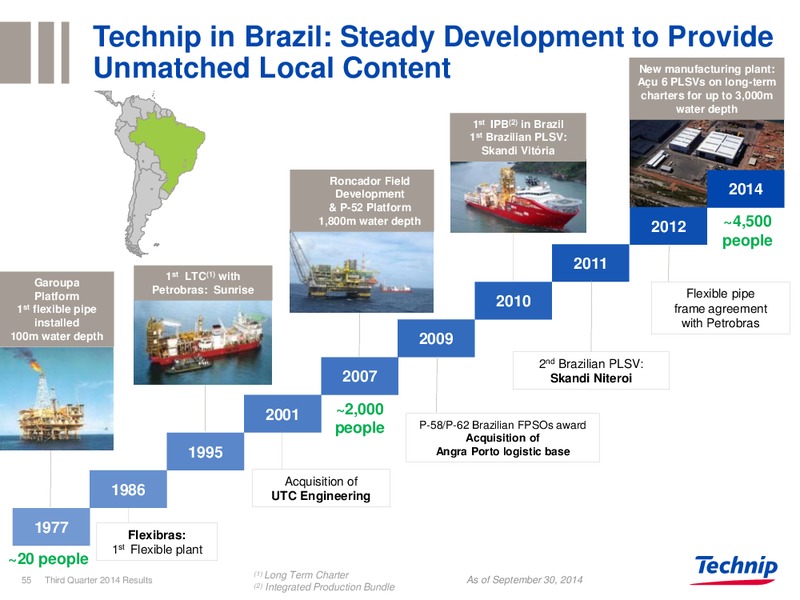
Technip in Brazil: Steady Development to Provide Unmatched Local Content New manufacturing plant: Au 6 PLSVs on long-term charters for up to 3,000m water depth 1st IPB(2) in Brazil 1st Brazilian PLSV: Skandi Vitria Roncador…
 Loading...