Investor Relations Presentation EQT Midstream Partners-EQT GP Holdings April 2017 1
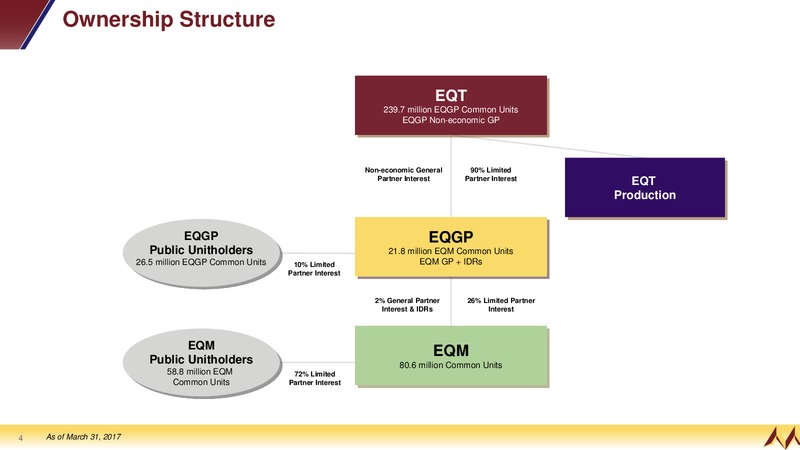
Ownership Structure EQT 239.7 million EQGP Common Units EQGP Non-economic GP Non-economic General 90% Limited Partner Interest Partner Interest EQT Production EQGP EQGP Public Unitholders 21.8 million EQM Common Units…
Investment Highlights Premier Strong Balance Assets in the Sheet Marcellus & 1.5x Deep Utica 20% Annual Debt/EBITDA Distribution Growth at 90% of EQM in 2017 Revenue from Capacity Reservation 1.4x EQM Charges Coverage…
Asset Overview Transmission and Storage Assets Overlay Prolific Nat Gas Plays Equitrans Transmission & Storage 4.4 Bcf/d current capacity 950 mile FERC-regulated interstate pipeline 43 Bcf of gas storage capacity Ohio Valley…
Asset Overview Marcellus Gathering Pennsylvania Asset Map Prolific Greene County, PA dry gas Terra 975 MMcf per day firm capacity 600 MMcf per day high pressure header pipeline for Range Resources Header Pipeline Expected Q2…
Growth Strategies Expand Supply Hub Connect Supply and Demand Leverage existing asset footprint to Extend network to connect supply expand Marcellus/Utica supply hub hub to growing demand markets Transmission capacity of 4.4 Bcf/d…
Growth Strategy Supply Hub Marcellus / Utica to become dominant supply source in U.S. Marcellus/Utica Supply Growth* Assets Overlay Heart of Marcellus 50 40 30 Bcf/d 20 10 0 2010 2015 2020 2025…
Growth Strategy Supply Hub Sponsor a Leading Marcellus Producer Sponsor Highlights EQT Core Marcellus Areas EQT is a prominent Marcellus producer 26% sales volume growth in 2016 11.2 Tcfe total Marcellus proved reserves* 44 Tcfe…
Growth Strategy Supply Hub Upside potential from deep Utica volumes Utica Growth Opportunity EQT Utica Position EQT testing deep Utica opportunity 2016 wells 2017 wells Target 3 - 3.5 Bcf/1,000 EUR 500,000 EQT net acres…
Growth Strategy Extend Pipeline Network Supply / Demand dynamics creating new opportunities Regional Supply/Demand Balance* Access to Multiple Markets Shifting market dynamics requires new infrastructure solutions EQM assets…
Growth Strategy Extend Pipeline Network Ohio Valley Connector Overview Asset Map Provides Marcellus producers access to Midwest markets Provides Utica producers access to Equitrans transmission system Placed in-service Q4 2016…
Growth Strategy Extend Pipeline Network Mountain Valley Pipeline Overview Project Map Pipeline to growing natural gas demand market in southeast US 300-mile FERC-regulated pipeline 42 pipe diameter 3.0B-3.5B total project cost…
Distribution Growth EQM EQGP 0.30 1.06 1.4x coverage trailing 12-months 1.0x target coverage 20% annual distribution growth 56% distribution growth in 2016 1.00 0.27 through 2017 40% distribution growth in 2017 0.94 Beginning in…
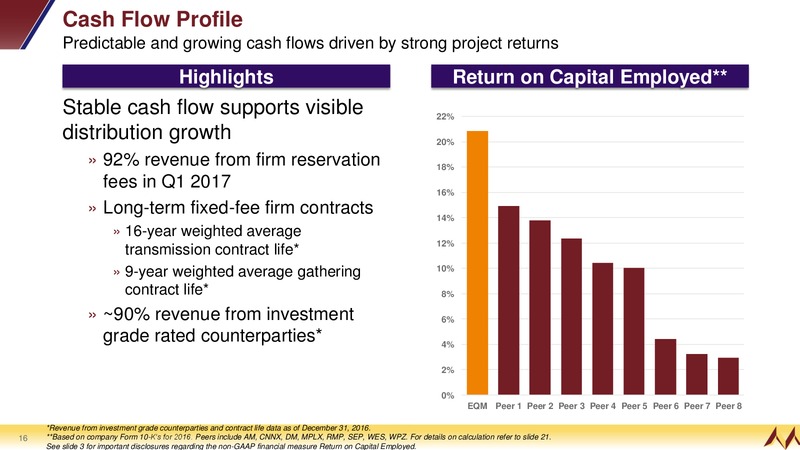
Cash Flow Profile Predictable and growing cash flows driven by strong project returns Highlights Return on Capital Employed** Stable cash flow supports visible 22% distribution growth 20% 92% revenue from firm reservation 18%…
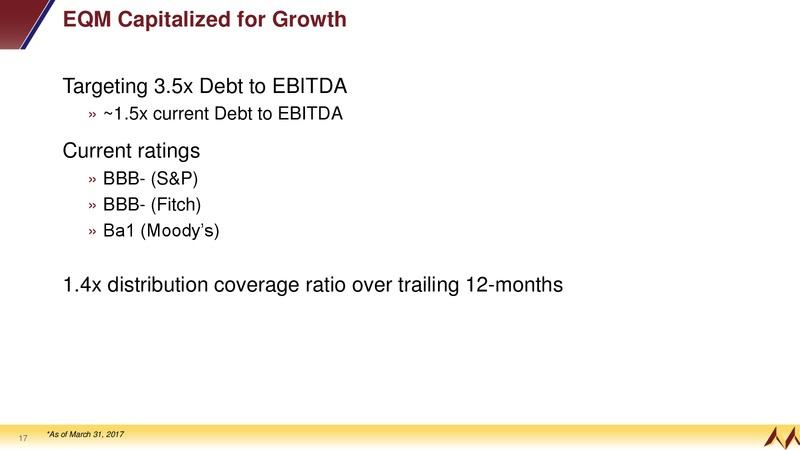
EQM Capitalized for Growth Targeting 3.5x Debt to EBITDA 1.5x current Debt to EBITDA Current ratings BBB- (S&P) BBB- (Fitch) Ba1 (Moodys) 1.4x distribution coverage ratio over trailing 12-months *As of March 31, 2017 17
Investment Highlights EQM EQGP Strategically located assets in the Expected to be one of the fastest rapidly growing Marcellus & Deep growing MLPs Utica 56% distribution growth in 2016 40% distribution growth in 2017 Executing on…
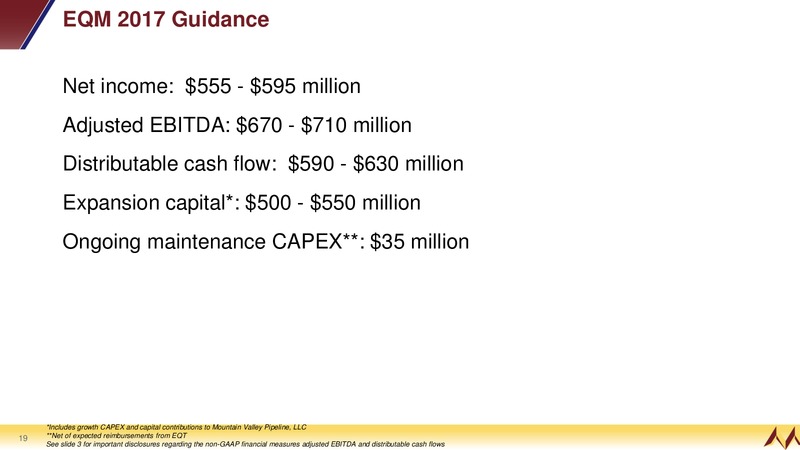
EQM 2017 Guidance Net income: 555 - 595 million Adjusted EBITDA: 670 - 710 million Distributable cash flow: 590 - 630 million Expansion capital*: 500 - 550 million Ongoing maintenance CAPEX**: 35 million *Includes growth…
APPENDIX 20
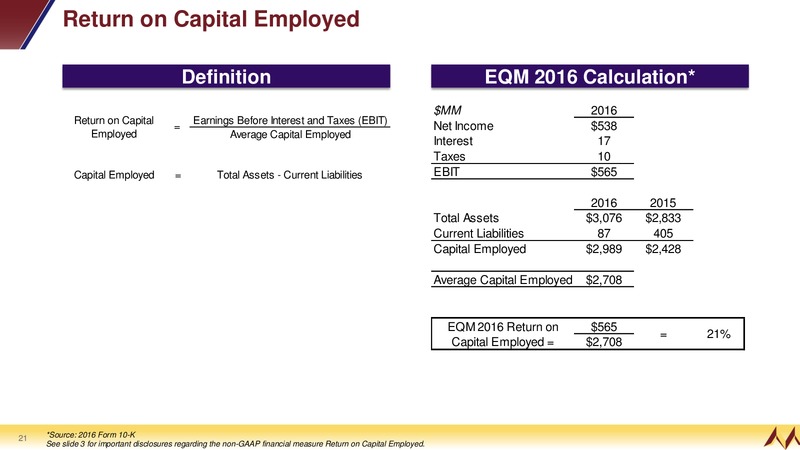
Return on Capital Employed Definition EQM 2016 Calculation* MM 2016 Return on Capital Earnings Before Interest and Taxes (EBIT) = Net Income 538 Employed Average Capital Employed Interest 17 Taxes 10 Capital Employed = Total…
 Loading...