Investor Presentation Investor Presentation June 2017 November Nasdaq Ticker: 2016 PVAC
Penn Virginia Corporation - Company Overview Focused Eagle Ford Shale Producer Financial & Operational Profile Independent E&P company with primary Exchange: Ticker NASDAQ: PVAC focus in volatile oil window of Eagle Ford Share Price…
Penn Virginia Today Solid Q1 2017 Operating and Financial Performance Exceeded guidance with Q1 2017 production of 9,495 BOEPD, or 855 MBOE (71% crude oil) Successfully tested slickwater completion design in Area 2 with Lager 3H…
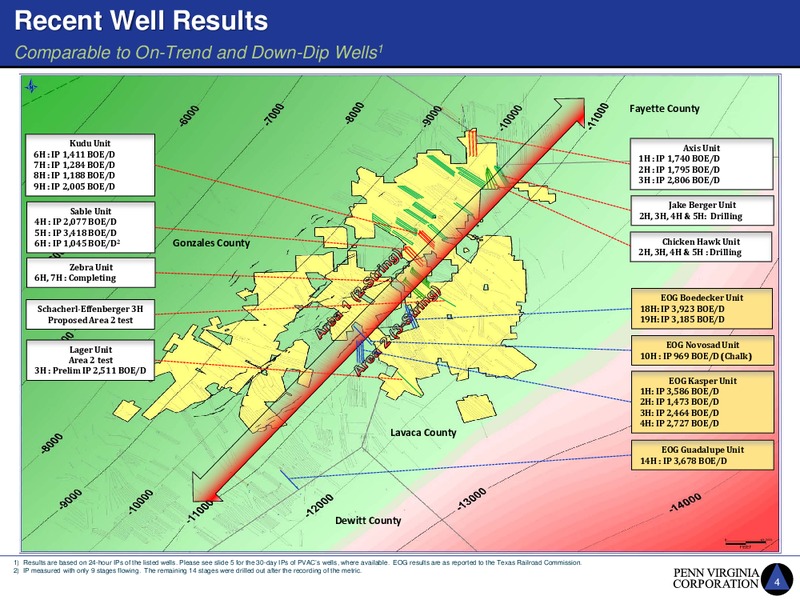
Recent Well Results Comparable to On-Trend and Down-Dip Wells1 Fayette County Kudu Unit Axis Unit 6H : IP 1,411 BOE/D 1H : IP 1,740 BOE/D 7H : IP 1,284 BOE/D 2H : IP 1,795 BOE/D 8H : IP 1,188 BOE/D 3H : IP 2,806 BOE/D 9H : IP…
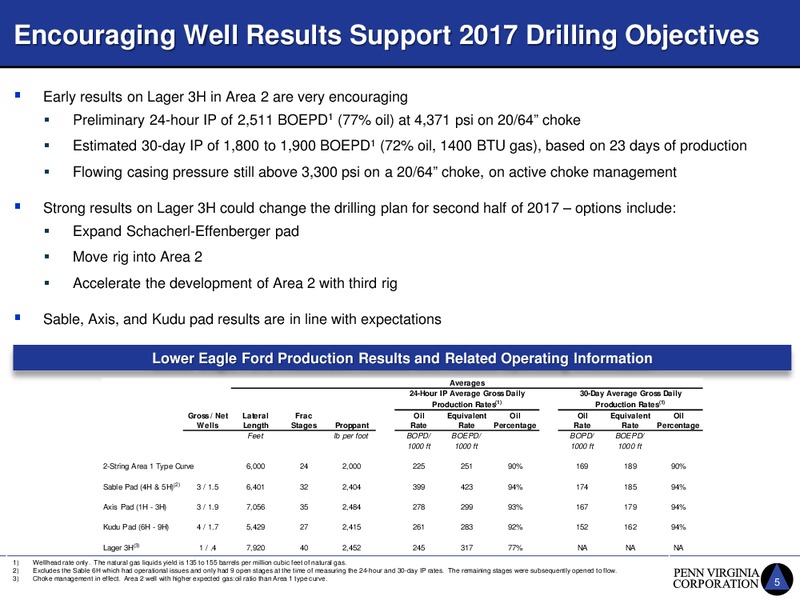
Encouraging Well Results Support 2017 Drilling Objectives Early results on Lager 3H in Area 2 are very encouraging Preliminary 24-hour IP of 2,511 BOEPD1 (77% oil) at 4,371 psi on 20/64 choke Estimated 30-day IP of 1,800 to 1,900…
Attractive Eagle Ford Type Curve and Economics Approximately 50% Estimated Rate of Return at 50/barrel WTI Oil Price Area 1 Lower Eagle Ford Type Curve1 Well Economics Have Improved Substantially 300 1,000 Daily Oil Production (BOPD)…
Improved Slickwater Completion Design Driving Returns Transition to slickwater and ongoing completion design evolution has resulted in a step change in well performance Test of Gen 4 completion design on 18 gross wells in 2017…
Efficiency Driving Returns Focused on Improving Cost Structure and Maximizing Returns D&C Costs per Lateral Foot Continue to Decline D&C costs reduced 55% since 2013/2014 Footage drilled / day has increased 45% since 2013…
Top Quartile Cost Structure Substantial Changes Have Positioned the Company Among the Top Quartile of Peers 2016 LOE (/BOE) Penn Virginias cost structure is competitive 8.40 with the peer group 7.35 CY2016 Ave. LOE 5.76/BOE 6.38…
Q1 2017 Financial Overview ( thousands) Three Months Three Months Ended Ended Highlights (compared to Q4 2016) March 31, December 31, 2017 2016 Revenues Crude oil 30,073 27,649 7.4% increase in total product revenue Natural gas…
Simple Capital Structure - Ample Liquidity Highlights 100.0 Million of Liquidity as of May 30, 2017 Credit facility is only debt 128.0 37.0 30 million drawn at 3/31/17 128 million borrowing base 100.0 0.8 9.8 200 million credit…
Delivering Production Growth through 2018 2017 and 2018 Guidance Key Highlights Strong growth in second half of 2017 with super pad expected to come online in Q3 2017 Projecting 20% to 30% growth through 2018, with exit rate for…
Substantial Portion of Oil Production is Hedged Oil Hedges Swap portfolio has provided downside protection Mark to market at Q1 2017 end was a net liability of 8.7 million Natural gas and NGL volumes are unhedged Oil Hedge…
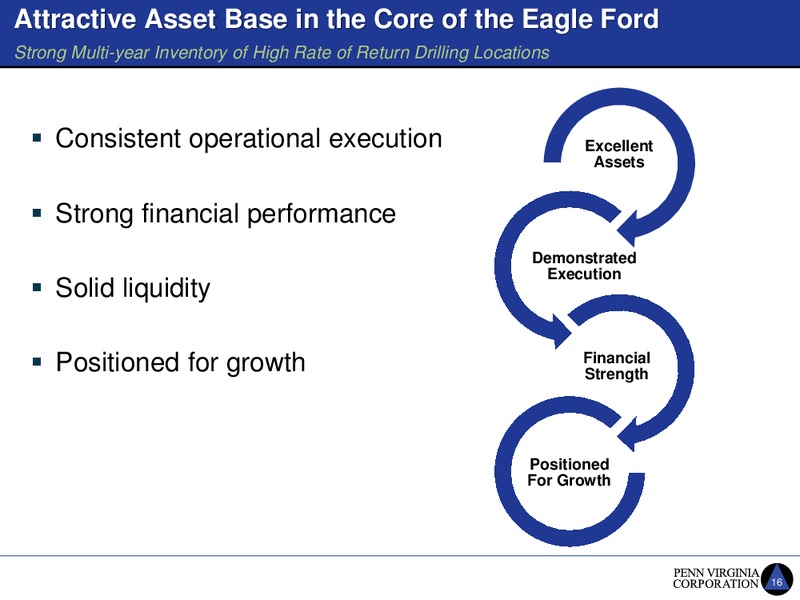
Attractive Asset Base in the Core of the Eagle Ford Strong Multi-year Inventory of High Rate of Return Drilling Locations Consistent operational execution Excellent Assets Strong financial performance Demonstrated Execution…
Non-GAAP Reconciliation Adjusted EBITDAX Successor Successor Predecessor Three Months Three Months Three Months Ended Ended Ended (in thousands) March 31, December 31, March 31, 2017 2016 2016 Reconciliation of GAAP Net income…
Non-GAAP Reconciliation Adjusted Cash G&A PENN VIRGINIA CORPORATION CERTAIN NON-GAAP FINANCIAL MEASURES - (unaudited) (in thousands) Year Ended December 31, 2014 2015 2016 General and administrative expense, as reported 1 49,005…
Non-GAAP Reconciliation - PV-10 PENN VIRGINIA CORPORATION CERTAIN NON-GAAP FINANCIAL MEASURES - unaudited (in thousands) Successor Predecessor December 31, December 31, 2016 2015 Reconciliation of GAAP Standardized Measure of…
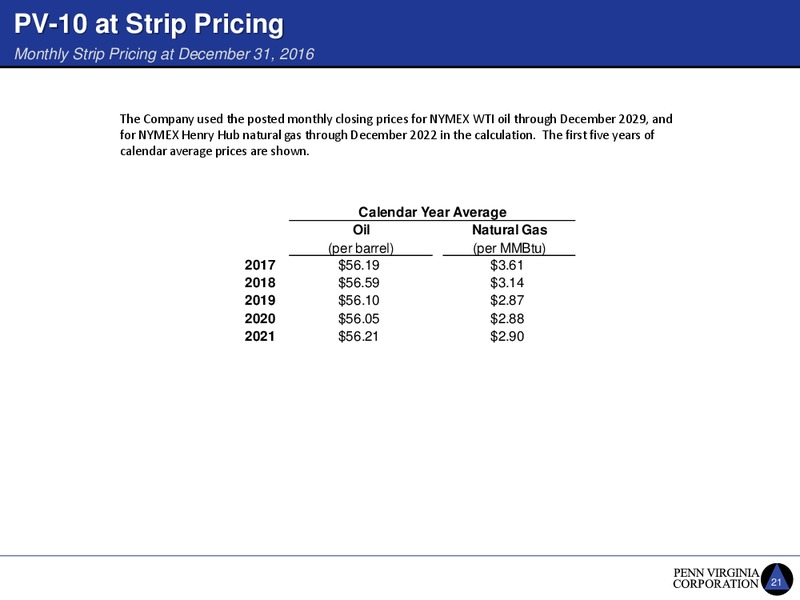
PV-10 at Strip Pricing Monthly Strip Pricing at December 31, 2016 The Company used the posted monthly closing prices for NYMEX WTI oil through December 2029, and for NYMEX Henry Hub natural gas through December 2022 in the…
 Loading...