Technology-Focused, Pure-Play Energy Services Company Two business segments o Well Site Services - provides service equipment and personnel primarily for completion and production operations North American shale focused (70% of 1Q…
Positioned for a North American Recovery During the 2009-2014 cycle, Well Site Services accounted for 58% of Adjusted Segment EBITDA Strong North American markets should return segment contributions to historical relationships…
Optimal Balance Sheet- Ready for the Recovery 224 million of liquidity at March 31, 2017 Total debt to TTM Adjusted EBITDA was 0.4x at March 31, 2017 o Total gross debt to book capitalization ratio of 2.2%; on a net basis, cash…
Well Site Services
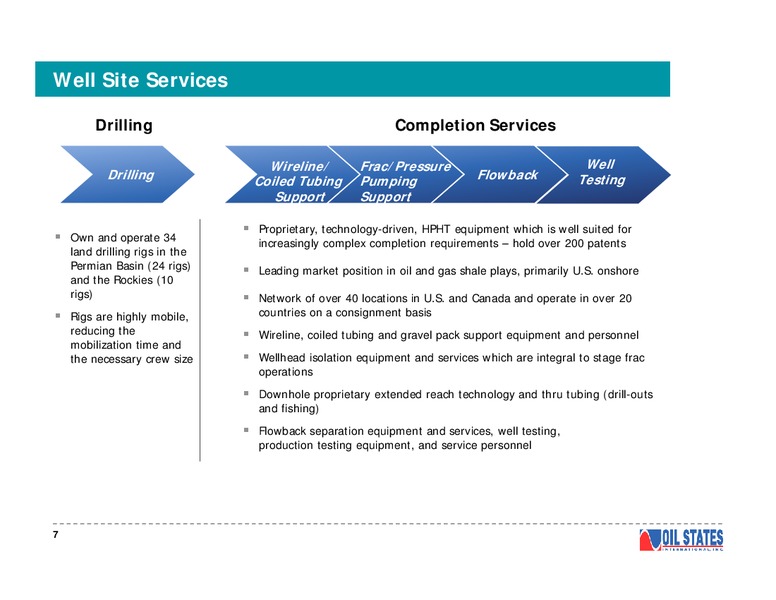
Well Site Services Drilling Completion Services Wireline/ Frac/Pressure Well Drilling Coiled Tubing Pumping Flowback Testing Support Support Proprietary, technology-driven, HPHT equipment which is well suited for Own and operate…
Broad North American Coverage U.S. Rig Region Locations Count (1) S. Texas, 9 453 Permian Northeast 4 73 Mid- Continent 6 89 N. Texas, 6 47 N. Louisiana Gulf Coast 6 21(2) Rockies 7 80 Manufacturing 2…
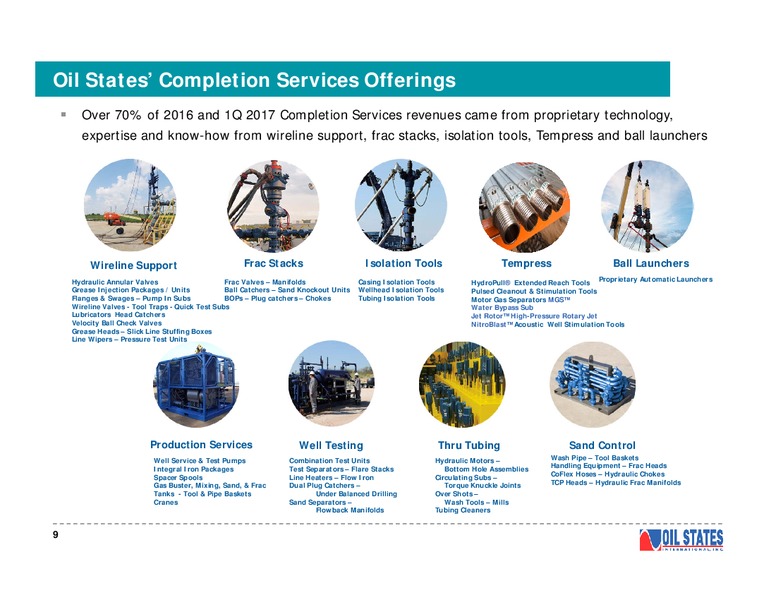
Oil States Completion Services Offerings Over 70% of 2016 and 1Q 2017 Completion Services revenues came from proprietary technology, expertise and know-how from wireline support, frac stacks, isolation tools, Tempress and ball…
Leverage to Activity-Based Incrementals Will Drive Near-Term Results Shale Well Completion Attributes and Benefits es t or s c s ol vi er g g ks pp tin n s r To ch Se es…
Offshore/Manufactured Products Segment
Diversified Product Offering Major project content opportunities for floating production facilities (FPSOs, TLPs and Spars), subsea pipelines and tie-backs along with shorter-cycle products (primarily destined for U.S. land…
Historical Backlog and Bookings Trends Exposure to deepwater production infrastructure and development projects has mitigated some of the commodity price volatility over the last two years as these deepwater projects are generally…
Offshore/Manufactured Products Revenue Components Total backlog of 204 million at March 31, 2017 provides revenue visibility (first sequential increase in backlog since 2Q 2014) Shorter-cycle products experiencing increased demand: o…
Deepwater Outlook- Driven by Worldwide Capital Spending FIDs expected to double globally in 2017 (20+), compared to 2016 (9) FPS market, which bottomed in 2016 with no orders placed, is poised for a recovery in 2017 due to the…
Conclusion
Key Drivers of Profitability Well Site Services o North American land market is recovering, with the total U.S. rig count up 537 rigs (133%) since the rig count troughed in May 2016 (as of June 23, 2017) o Service intensity is driven…
Outlook for Oil States North American land market is improving, led by the Permian basin Improved outlook for major project FIDs in 2017 Quality customer base Enviable balance sheet position Opportunity to deploy capital for…
Appendix
Strong Financial Position (USD in millions, except percentages and ratios) 3/31/2017 Actual Working Capital (excluding cash and current portion of debt) 290.3 Current Portion of Long Term Debt 0.5 Revolving Credit Facility (Matures…
Non-GAAP Reconciliation- Segment and Adjusted Segment EBITDA (USD in millions) For The Year Ending December 31, For the Three Months Ending, TTM 2009 2010 2011 2012 2013 2014 2015 2016 6/30/16 9/30/16 12/31/16 3/31/17 3/31/17 Well…
Non-GAAP Reconciliation- Consolidated and Adjusted Consolidated EBITDA (USD in millions) For the Three Months Ending, TTM 6/30/16 9/30/16 12/31/16 3/31/17 3/31/17 Oil States International, Inc. Net Loss From Continuing Operations…
 Loading...