THE 3 MAJOR 1 Low barriers to entry, especially for new Permian sand mines. 2 New capacity will quickly oversupply the market. 3 Macro events and industry trends affect all sand suppliers equally. 3
1 FACT Low barriers to entry, Despite all of the industry especially for new talk, its hard to add Permian sand mines. capacity. 4
FACT 1 Its a Lot More Complicated Than it Looks Numerous Challenges Resources & Relationships Critical in the Permian for Success Water Need a lot of cash and strong Infrastructure customer relationships Trucking Land and…
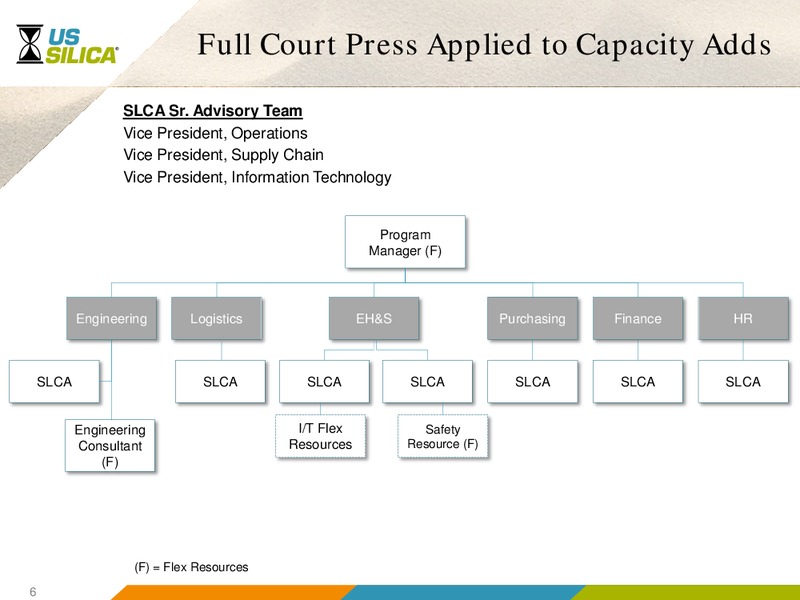
Full Court Press Applied to Capacity Adds SLCA Sr. Advisory Team Vice President, Operations Vice President, Supply Chain Vice President, Information Technology Program Manager (F) Engineering Logistics EH&S Purchasing…
2 FACT New capacity will Industry needs to add quickly oversupply capacity to meet the market. customers needs. 7
FACT 2 Industry Needs to Add Capacity Total projected industry demand greatly exceeds prior peak 2017: 70M-75M tons 2018: 100M tons Sand is not fungible due to logistics and reserve characteristics 2017: 70M-75M tons of demand…
Permian Sand Dynamics Estimate 20-25 million tons of in-basin capacity will be added (All fine grades, mostly 100 mesh) Timing difficult to predict (water access, permitting, etc.) Permian 100 mesh demand 20% of total market…
3 FACT Macro events SLCA the clear industry and industry trends leader with compelling impact sand suppliers competitive advantages equally. and best positioned to win. US horizontal rig count: 2014 present 10
SLCA Portfolio Best Matches Demand By Grade 100% Product mix better matched to 90% 29% market demand than peers 80% 45% 53% Demand for fine grades 70% expected to stay strong 60% 39% Multiple products in multiple 50%…
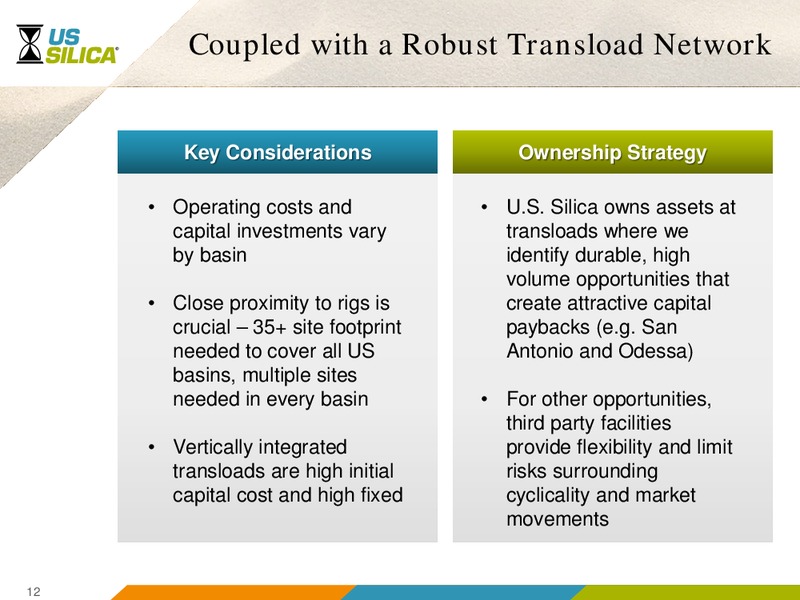
Coupled with a Robust Transload Network Key Considerations Ownership Strategy Operating costs and U.S. Silica owns assets at capital investments vary transloads where we by basin identify durable, high volume opportunities that…
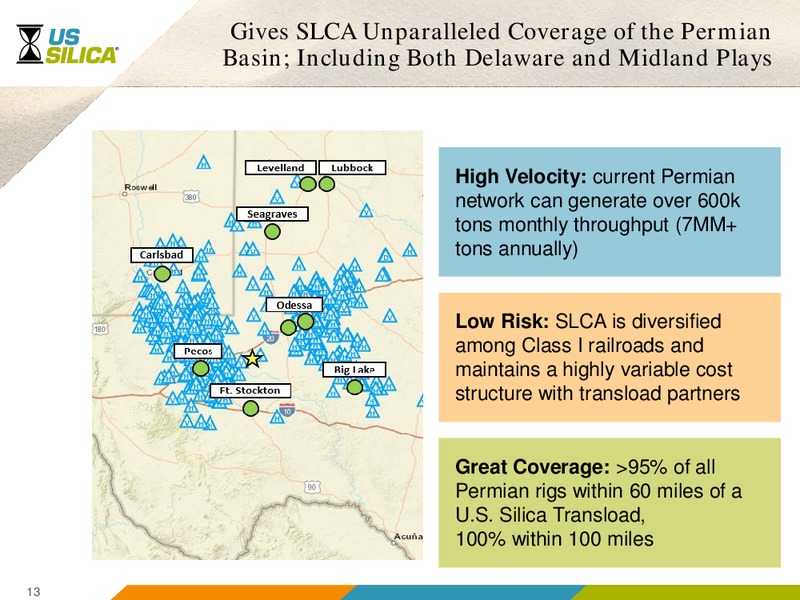
Gives SLCA Unparalleled Coverage of the Permian Basin; Including Both Delaware and Midland Plays High Velocity: current Permian network can generate over 600k tons monthly throughput (7MM+ tons annually) Low Risk: SLCA is…
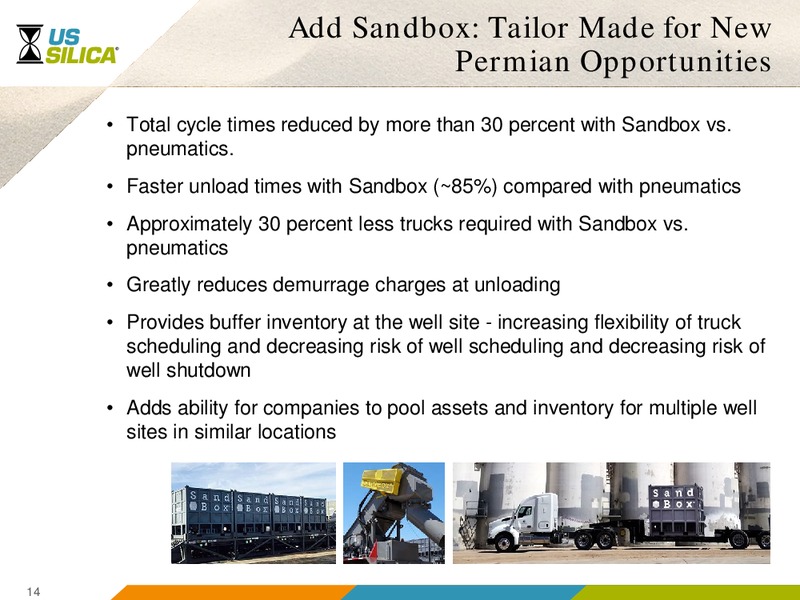
Add Sandbox: Tailor Made for New Permian Opportunities Total cycle times reduced by more than 30 percent with Sandbox vs. pneumatics. Faster unload times with Sandbox (85%) compared with pneumatics Approximately 30 percent less…
U.S. Silica Best Positioned to Win Proven Winning through the cycle Performance + Cost Logistical capabilities, Advantages efficient mines + Best Balance Advantage Strength and flexibility Sheet U.S. Silica + Capturing…
 Loading...