N E W PA R K R E S O U R C E S P R E S E N TAT I O N JUNE 2017
C O M PA N Y O V E R V I E W Consolidated Revenues Two Operating Segments: 1,400 Full Year 1,200 First Quarter 1,118 1,042 Fluids Systems 984 Revenues ( millions) 1,000 Oil and Gas exploration 800 677 600 Mats and…
GLOBAL STRENGTH Revenue by Region U.S. Canada Latin America EMEA/APAC 18% 28% 28% 39% 8% 7% 7% 6% 8% 12% 9% 7% 67% 57% 54% 45% 2014 2015 2016 Q1 2017 4
STRENGTHENED BY OUR INVESTMENTS Elevated capital campaign completed Mats: Completed Manufacturing 2015 and Technology Center 2016 Infrastructure investments open new markets and significantly enhance our competitiveness Reflects…
FLUIDS SYSTEMS-OVERVIEW Total Segment Revenues 1,200 Full Year Largest independent drilling 1,000 965 862 926 First Quarter fluids provider Revenues ( millions) 800 581 3rd largest drilling fluids 600 company worldwide*…
FLUIDS SYSTEMS-TECHNOLOGY Proven drilling fluid systems designed to enhance wellsite performance Evolution high-performance, water-based technology for global applications Fusion brine fluid system creates a unique enhancement for…
FLUIDS SYSTEMS NORTH AMERICA North American Revenues 800 700 654 687 Full Year Revenues impacted by drilling Revenue ( millions) 615 First Quarter 600 activity and operators reducing 500 well expenditures 400 352 300 200…
F L U I D S S Y S T E M S I N T E R N AT I O N A L International Revenues 350 Full Year International expansion is key to our 300 272 278 First Quarter strategy 246 250 229 212 More stable than NAM, through the 200 industry…
M AT S & I N T E G R AT E D S E R V I C E S - O V E R V I E W Leading provider of engineered worksite solutions Patented technology, service capability and size of composite mat rental fleet provide competitive advantage Recent…
M AT S & I N T E G R AT E D S E R V I C E S S T R A T E G Y A N D S Y S T E M S Diversifying beyond the wellsite Accelerate penetration of non- exploration markets, both domestically and internationally Larger addressable market…
M AT S & I N T E G R AT E D S E R V I C E S M A R K E T D I V E R S I F I C A T I O N Following historic collapse of O&G Segment Revenue and EBITDA Margin 200 60% activity in 2015, expansion of business 180 50% outside of NAM…
FINANCIAL FOCUS Capital Structure Total Debt Net Debt Debt to Book Capital Ratio Short-Term Actions 300 35% Focused on managing cost structure 250 256 as NAM activity levels improve 32% 209 Continuing efforts to optimize 200 183 182…
APPENDIX
C O N S O L I D AT E D S T AT E M E N T S O F O P E R A T I O N S Three Months Ended March 31, December 31, March 31, (In thousands, except per share data) 2017 2016 2016 Revenues 158,691 137,083 114,544 Cost of revenues 129,590…
O P E R AT I N G S E G M E N T R E S U LT S Three Months Ended March 31, December 31, March 31, (In thousands) 2017 2016 2016 Revenues Fluids systems 136,050 111,560 98,651 Mats and integrated services 22,641 25,523 15,893 Total…
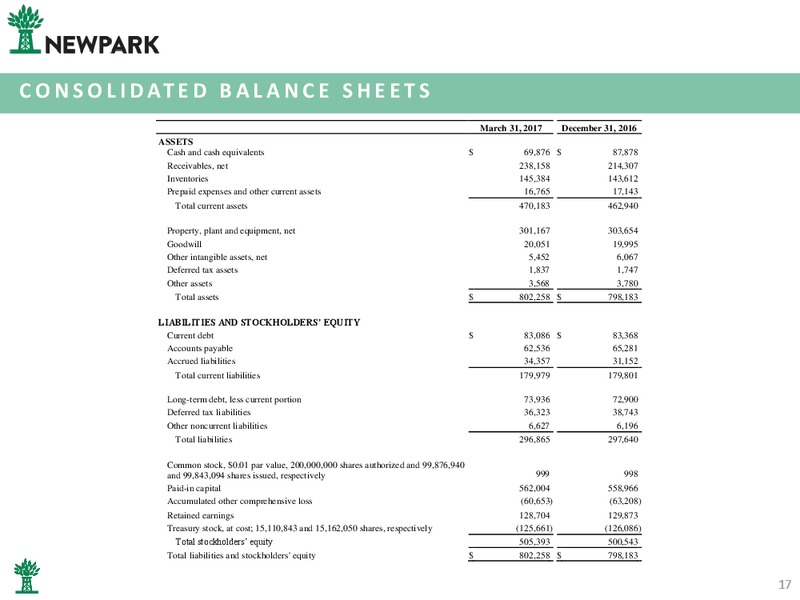
C O N S O L I D AT E D B A L A N C E S H E E T S March 31, 2017 December 31, 2016 ASSETS Cash and cash equivalents 69,876 87,878 Receivables, net 238,158 214,307 Inventories 145,384 143,612 Prepaid expenses and other current assets…
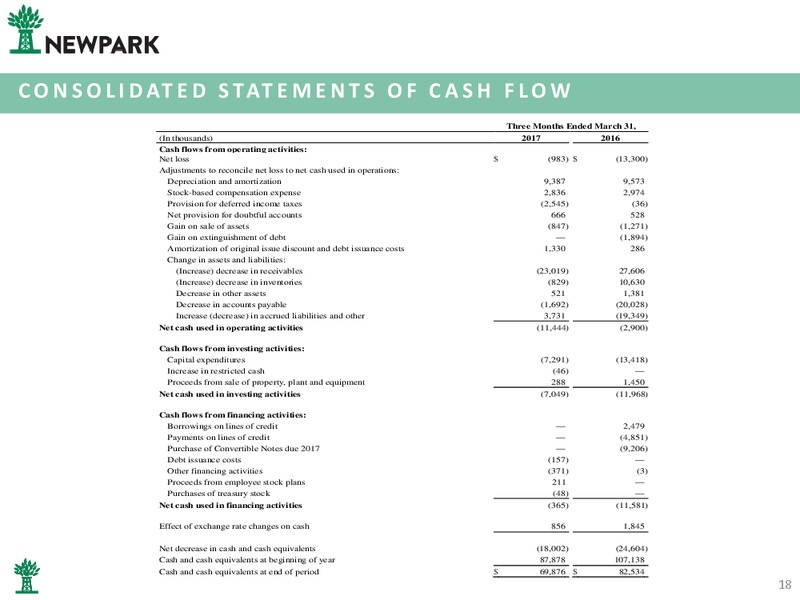
C O N S O L I D AT E D S TAT E M E N T S O F C A S H F L O W Three Months Ended March 31, (In thousands) 2017 2016 Cash flows from operating activities: Net loss (983) (13,300) Adjustments to reconcile net loss to net cash used in…
NON-GAAP FINANCIAL MEASURES We consider earnings before interest, taxes, depreciation and amortization (EBITDA) and EBITDA Margin to be important supplemental performance measures and believe they are frequently used by investors,…
EXPERIENCED LEADERSHIP Paul Howes President & CEO Gregg Piontek Vice President & CFO Mark Airola SVP, GC & Admin Officer Bruce Smith President Fluids Systems Matthew Lanigan President Mats & Integrated Services Ida Ashley…
 Loading...