Drew Zieglgansberger Executive Vice-President Achieving our potential Deep Basin New York September 7, 2017
About Cenovus TSX, NYSE CVE Enterprise value C 24 billion Shares outstanding 1,229 million 2017F production (1) Oil sands 296 Mbbls/d Deep Basin Oil & liquids 20 Mbbls/d Natural gas 325 MMcf/d Legacy conventional Oil & liquids…
Delivering on our potential 2017F target milestones 2018F Transaction 2021Fistarget fully financed milestones Continued to demonstrate strong operations Sanction ready on Foster Creek phase H Announced transformational acquisition…
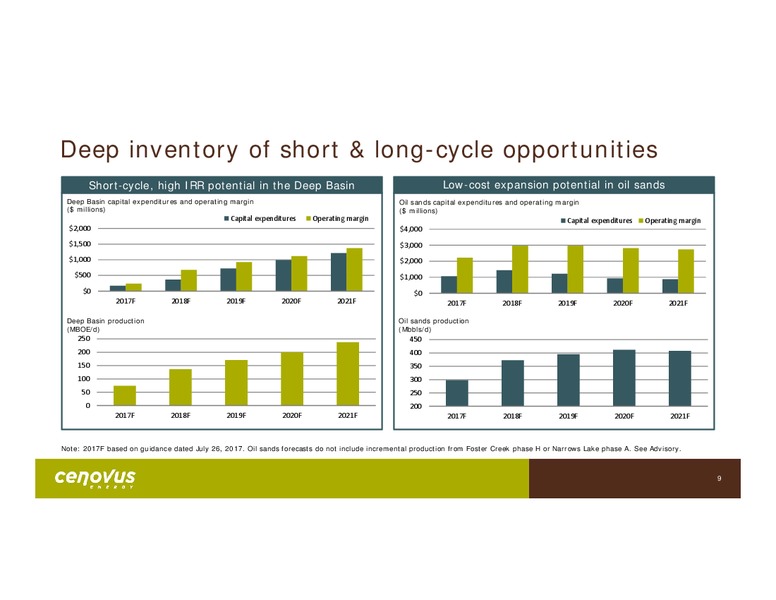
Deep inventory of short & long-cycle opportunities Short-cycle, high IRR potential in the Deep Basin Low-cost expansion potential in oil sands Deep Basin capital expenditures and operating margin Oil sands capital expenditures and…
A compelling five-year outlook Increased scale and depth of portfolio Second growth platform provides capital flexibility Targeting 4.0 - 5.0 of announced asset sales in 2017 Total Cenovus capital expenditures and operating margin (…
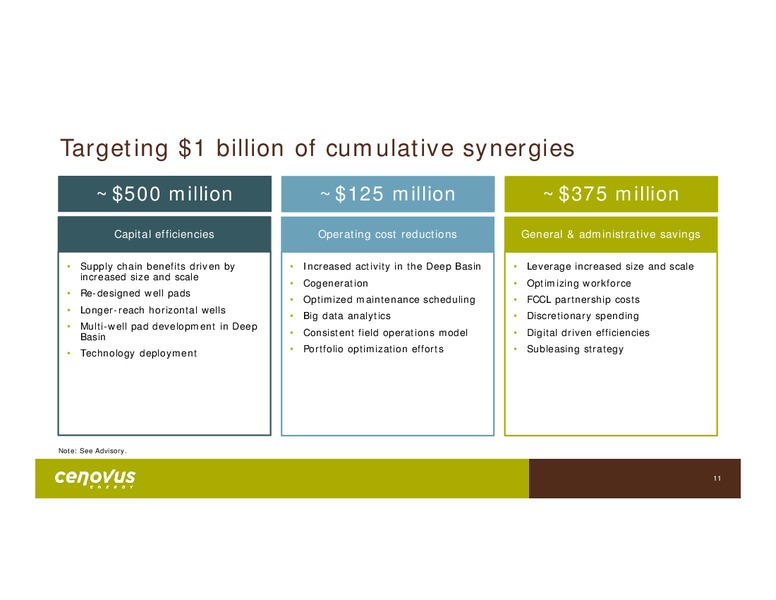
Targeting 1 billion of cumulative synergies 500 million 125 million 375 million Capital efficiencies Operating cost reductions General & administrative savings Supply chain benefits driven by Increased activity in the Deep Basin…
Liquidity position supports resilience Liquidity position Near-term debt reduction Manageable long-term maturities Net debt Principal outstanding ( billions) 4.5 billion (US billions) 0.5 billion 4.5 billion 16 2.0 cash on hand…
Sustainability drives free funds flow Low corporate decline rates Improved sustainability Free funds flow growth over time 2017F Corporate decline rate Implied WTI breakeven Total Cenovus capital expenditures and operating margin…
Improvement drives sustainable reductions Improved Longer horizontal conformance wells Better conformance along the Capture a larger drainage area full horizontal well length Fewer wells to recover the same Lower SOR resource Higher…
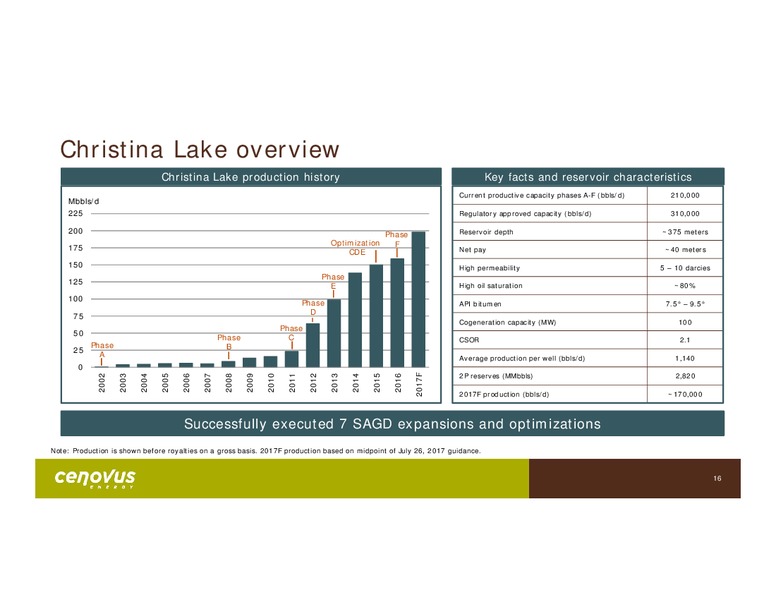
Christina Lake overview Christina Lake production history Key facts and reservoir characteristics Current productive capacity phases A-F (bbls/d) 210,000 Mbbls/d 225 Regulatory approved capacity (bbls/d) 310,000 200 Reservoir depth…
Phase G builds on Christina Lake success Best-in-class oil sands project Christina Lake phase G project profile Industry-leading steam-oil ratio of 1.7 Christina Lake phase G capital profile ( millions) Strong capital efficiencies…
Foster Creek overview Foster Creek production history Key facts and reservoir characteristics Current productive capacity phases A-G (bbls/d) 180,000 Mbbls/d 175 Regulatory approved capacity (bbls/d) 295,000 Phase G Reservoir depth…
Foster Creek phase H on track to be sanction ready Benefiting from pre-build on phases F&G Illustrative Foster Creek phase H project profile Plan to complete the remaining plant construction and Foster Creek phase H capital profile (…
Commercializing solvents at Narrows Lake Improving greenfield development at Narrows Lake Illustrative Narrows Lake phase A project profile Plant construction approximately 25% complete Narrows Lake phase A capital profile ( millions)…
Deep Basin provides second growth platform One of the largest Deep Basin land positions Three core operating areas: Elmworth-Wapiti, Kaybob-Edson, and Clearwater Low decline production base coupled with significant liquids-rich…
No near-term takeaway constraints Asset overview Deep Basin infrastructure map 1.4 BCF/d of net natural gas processing capacity and significant associated gathering infrastructure Infrastructure footprint spans the Deep Basin…
Future upside potential across acreage Net acreage Drilling opportunities / 1,000 acres Pro forma 2P reserves MM net acres Drilling opportunities / 1,000 net acres MMBOE 3,500 10.0 2,000 9.0 3,000 8.0 1,500 2,500 7.0 6.0 2,000 5.0…
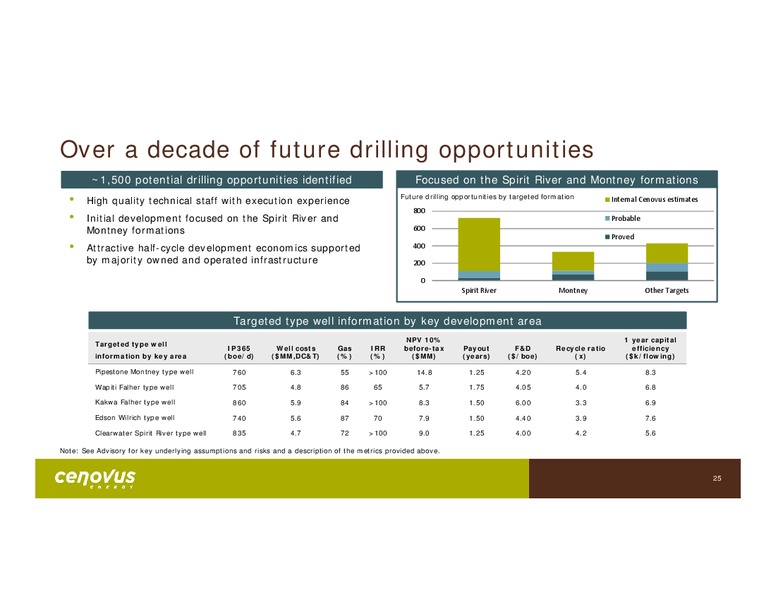
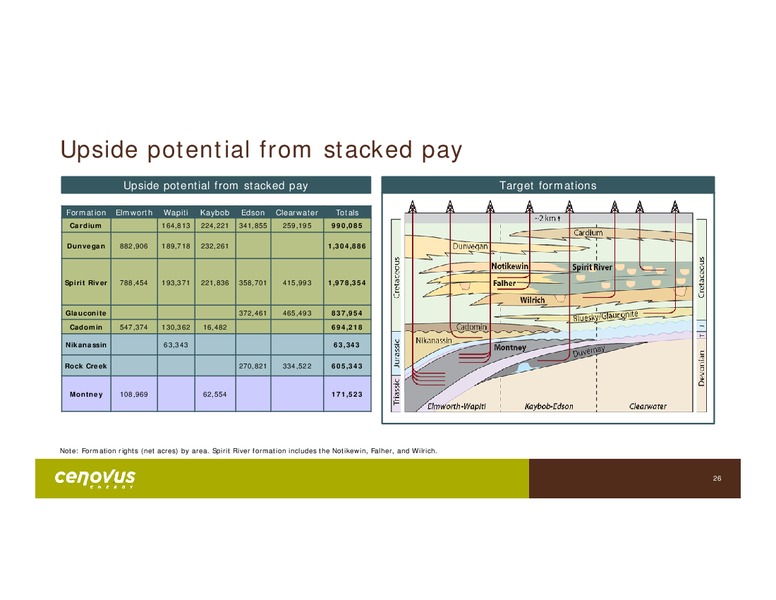
Over a decade of future drilling opportunities 1,500 potential drilling opportunities identified Focused on the Spirit River and Montney formations Future drilling opportunities by targeted formation High quality technical staff with…
Focus on high quality and low risk locations Initial drilling plans through March 2018 focused on development and appraisal 2017 - 2018 drilling June July August September October November December January February March Pipestone…
Delivering on our potential 2017F target milestones 2018F Transaction 2021Fistarget fully financed milestones Continued to demonstrate strong operations Sanction ready on Foster Creek phase H Announced transformational acquisition…
Investor relations contacts Kam Sandhar Vice-President, Investor Relations & Corporate Development kam.sandharcenovus.com 403.766.5883 Steven Murray Manager, Investor Relations steven.murraycenovus.com 403.766.3382 Graham Ingram…
 Loading...