Strong Asset Base Poised for Growth A Strong Footprint in And a Leading Position at Drive Targas Active Basins Mont Belvieu Long-Term Growth Premier Permian Basin footprint Premier fractionation ownership Well positioned to…
Strategic Outlook Increasing producer activity drives the need for additional G&P infrastructure Adding over 1 Bcf/d of incremental natural gas processing capacity in 2017 and 2018 (1) Adding four new plants and 775 MMcf/d of…
Attractive Asset Footprint Targas assets are positioned in some of the best U.S. basins (Permian - Midland, Permian Delaware, STACK, SCOOP, Bakken and Eagle Ford) Integration of G&P and Downstream assets continued area of…
Business Mix, Diversity and Fee-Based Margin Business Mix Field G&P Diversity Operating Margin(1) Q1 2017 Natural Gas Inlet Volumes 2% 10% 15% 45% 27% 16% 55% 11% 5% 6% 7% Downstream G&P SAOU * WestTX * Sand Hills *…
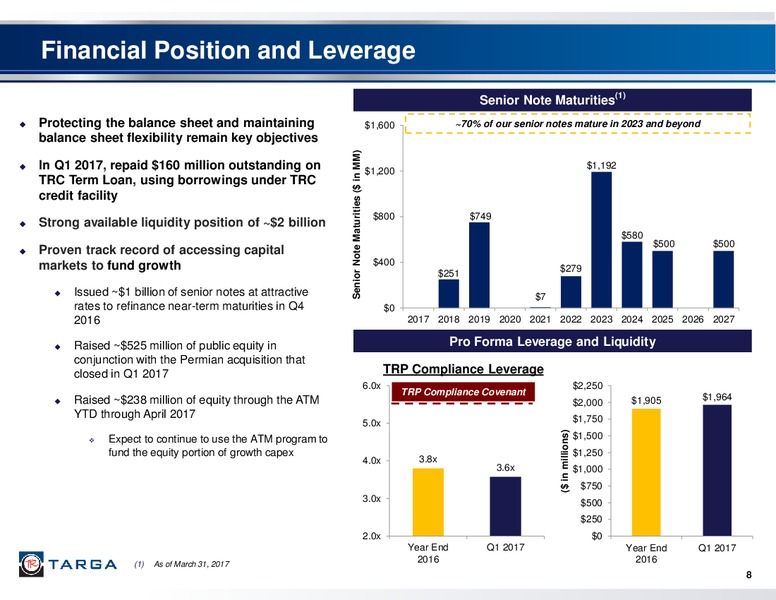
Financial Position and Leverage (1) Senior Note Maturities Protecting the balance sheet and maintaining 1,600 70% of our senior notes mature in 2023 and beyond balance sheet flexibility remain key objectives Senior Note…
Diversity and Scale Help Mitigate Commodity Price Changes Growth has been driven primarily by investing in Adjusted EBITDA vs. Commodity Prices the business, not by changes in commodity prices Adjusted EBITDA - Actual YTD Adjusted…
2017 Announced Net Growth Capex With the continued growth in upstream activity around our G&P systems, we now estimate 960 million of 2017 net growth capex from the projects outlined below Adding additional gas processing capacity to…
Operational and Financial Expectations LPG Export Substantially contracted over the long term at attractive rates Contracts Expect a mix of long-term and short-term volumes moving across our dock, proving potential for volume at…
Attractive Asset Footprint
Extensive Field Gathering and Processing Position Summary Footprint Over 26,000 miles of pipeline across attractive positions 4.7 Bcf/d of gross processing capacity(2)(3)(4) Acquired additional Delaware and Midland Basin assets on…
Premier Permian Position Legend Active Rigs (4/18/17) 2 million dedicated Processing Plant Processing Plant In acres from a diverse Progress group of producers Crude Terminal Pipeline Pipeline In Progress (1) 2.5 Bcf/d(1) of total…
Permian Midland Summary (WestTX and SAOU systems) Summary Asset Map and Rig Activity(1) Legend WestTX and SAOU systems located across the core Active Rigs (4/18/17) of the Midland Basin Processing Plant Processing Plant In Operate…
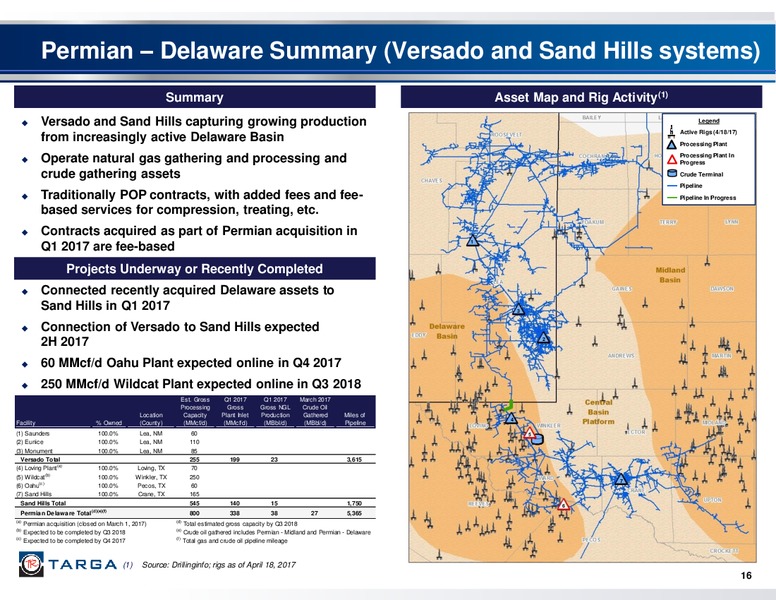
Permian Delaware Summary (Versado and Sand Hills systems) Summary Asset Map and Rig Activity(1) Versado and Sand Hills capturing growing production Legend Active Rigs (4/18/17) from increasingly active Delaware Basin Processing…
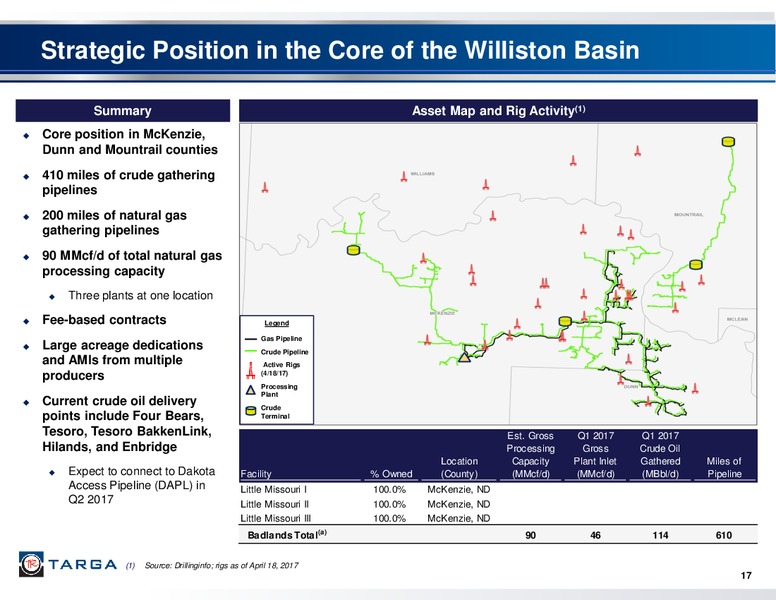
Strategic Position in the Core of the Williston Basin Summary Asset Map and Rig Activity(1) Core position in McKenzie, Dunn and Mountrail counties 410 miles of crude gathering pipelines 200 miles of natural gas gathering…
Leading Oklahoma, North Texas and South Texas Positions Summary Footprint Four asset regions which include approximately 14,000 miles of pipeline Over 2.1 Bcf/d of gross processing capacity(2) 15 processing plants across the…
SouthTX Sanchez Energy Corp. JV Driving Growth Summary Asset Map and Rig Activity(1) JV agreements with Sanchez Energy Corp. (NYSE:SN) Legend executed in October 2015 Pipeline Active Rigs (4/18/17) Gathering JV interest…
North Texas Exposed to Barnett Shale and Marble Falls Summary Asset Map and Rig Activity(1) 478 MMcf/d of gross processing capacity Legend Pipeline Active Rigs Primarily Barnett Shale and Marble Falls (4/18/17) Processing…
SouthOK Exposure to Increasing SCOOP Activity Summary Asset Map and Rig Activity(1) 580 MMcf/d of gross processing capacity System well positioned to benefit from increasing SCOOP activity Currently building a line to benefit…
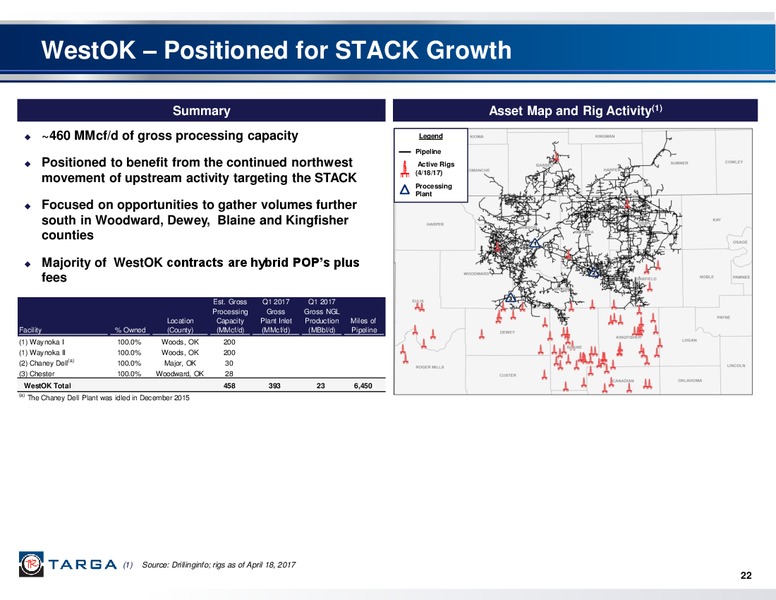
WestOK Positioned for STACK Growth Summary Asset Map and Rig Activity(1) 460 MMcf/d of gross processing capacity Legend Pipeline Positioned to benefit from the continued northwest Active Rigs (4/18/17) movement of upstream…
Producer Activity Drives NGL Flows to Mont Belvieu Growing field NGL production increases NGL flows to Mont Belvieu Rockies Increased NGL production will support Targas expanding Mont Belvieu and Galena Park presence…
Downstream Capabilities Overview Downstream Businesses The Logistics and Marketing segment represents NGL Fractionation / Storage approximately 45% of total operating margin(1) Strong fractionation asset position at Mont Belvieu and…
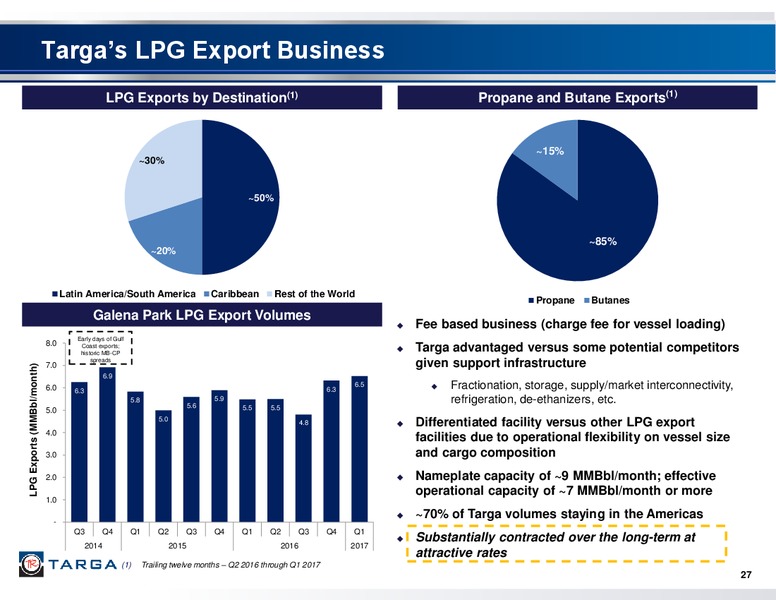
Targas LPG Export Business LPG Exports by Destination(1) Propane and Butane Exports(1) 15% 30% 50% 85% 20% Latin America/South America Caribbean Rest of the World Propane Butanes Galena Park LPG Export Volumes Fee…
Additional Information
Q1 2017 Permian Acquisition Earn-Out Structure Potential earn-out payments are based on realized gross margin(1) on existing contracts as of February 28, 2017 for the Permian Basin assets acquired on March 1, 2017 565 million of…
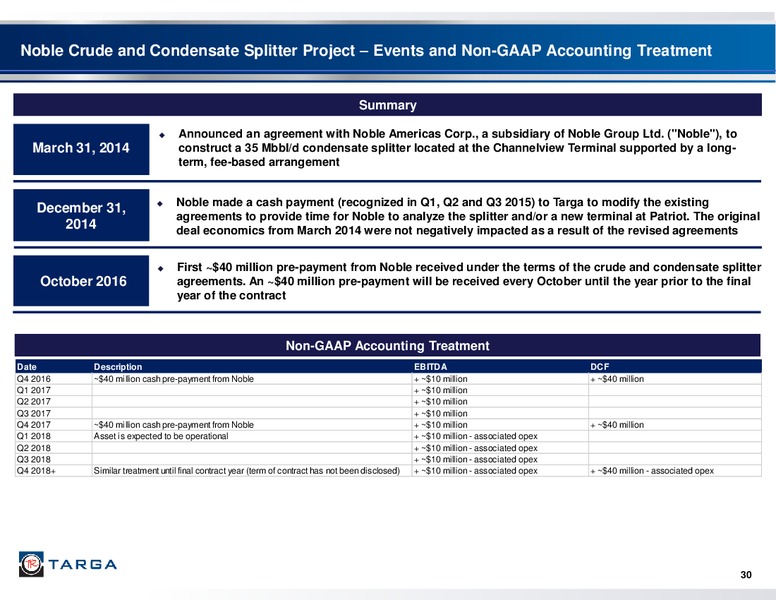
Noble Crude and Condensate Splitter Project Events and Non-GAAP Accounting Treatment Summary Announced an agreement with Noble Americas Corp., a subsidiary of Noble Group Ltd. (Noble), to March 31, 2014 construct a 35 Mbbl/d…
Coastal Gulf Coast Footprint Summary Footprint Asset position represents a competitively advantaged straddle option on Gulf of Mexico activity over time LOU (Louisiana Operating Unit) 440 MMcf/d of gas processing (180 MMcf/d…
Reconciliations
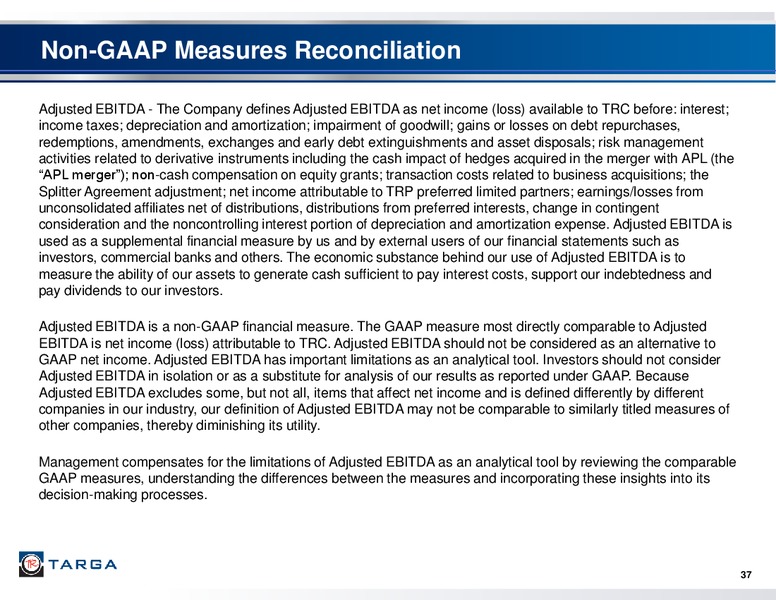
Non-GAAP Measures Reconciliation Adjusted EBITDA - The Company defines Adjusted EBITDA as net income (loss) available to TRC before: interest; income taxes; depreciation and amortization; impairment of goodwill; gains or losses on debt…
Non-GAAP Measures Reconciliation Distributable Cash Flow - The Company defines distributable cash flow as Adjusted EBITDA less distributions to TRP preferred limited partners, the Splitter Agreement adjustments, cash interest expense on…
Non-GAAP Reconciliations Q1 2017 EBITDA and DCF The following table presents a reconciliation of Adjusted EBITDA and Distributable Cash Flow for the periods shown for TRC: Three Months Ended March 31, 2017 2016 ( in millions)…
Non-GAAP Reconciliations Q1 2017 Gross Margin The following table presents a reconciliation of net income (loss) to operating margin and gross margin for the periods shown for TRC: Three Months Ended March 31, 2017 2016 ( in…
 Loading...