1Q16 highlights 3 1Q16 Ebitda of 293 m, down 22% YoY, due to lower oil price and fewer opportunities in the NG/LNG markets Hydrocracker planned maintenance during Q1 Working interest production of 56.3 kboepd, up 8% QoQ, due to…
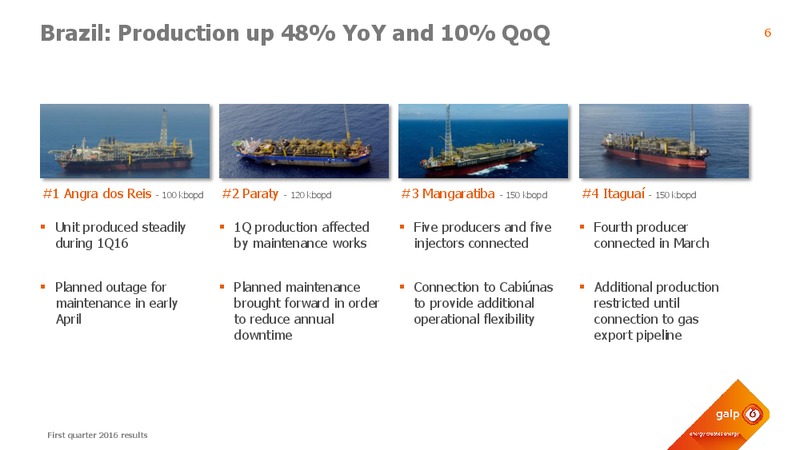
Brazil: Production up 48% YoY and 10% QoQ 6 1 Angra dos Reis - 100 kbopd 2 Paraty - 120 kbopd 3 Mangaratiba - 150 kbopd 4 Itagua - 150 kbopd Unit produced steadily 1Q production affected Five producers and five Fourth producer…
Lula/Iracema: FPSO 5 start-up in February 7 FPSO Cidade de Maric (5) 150 kbopd First producer connected with an average flow rate of c.33 kbopd Second producer and first gas injector connected in April First quarter 2016…
Santos basin: Gas export through Cabinas started in March 8 Existing gas export infrastructure FPSO 1 Already connected FPSO 2 Already connected FPSO 3 2Q16 FPSO 4 2Q16 FPSO 5 2H16 FPSO 6 2H16 First quarter 2016 results
Developing Galps portfolio in Africa 9 Mozambique: Coral Angola: block 32 and block 14/14k Aguarda imagem revista Focus on developing a robust FLNG solution for Coral Block 32: drilling campaign in Kaombo and FPSO construction…
Downstream and gas: resilient performance 10 Refining & Marketing Gas & Power Continuing to leverage arbitrage opportunities, Trading activity supported by structured contracts, namely gasoline exports to the U.S. despite fewer…
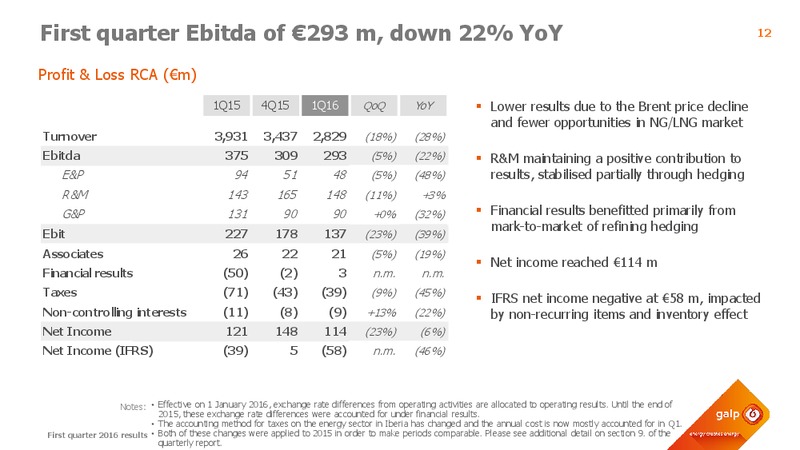
First quarter Ebitda of 293 m, down 22% YoY 12 Profit & Loss RCA (m) 1Q15 4Q15 1Q16 QoQ YoY Lower results due to the Brent price decline and fewer opportunities in NG/LNG market Turnover 3,931 3,437 2,829 (18%) (28%) Ebitda 375 309…
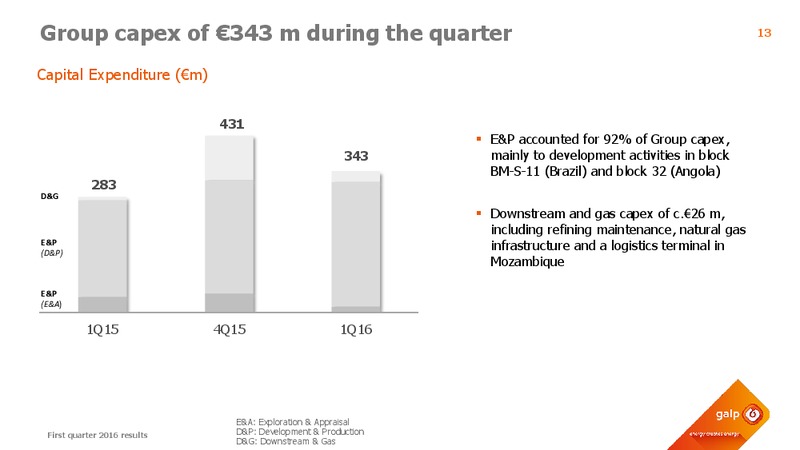
Group capex of 343 m during the quarter 13 Capital Expenditure (m) 431 E&P accounted for 92% of Group capex, 343 mainly to development activities in block BM-S-11 (Brazil) and block 32 (Angola) 283 D&G Downstream and gas capex…
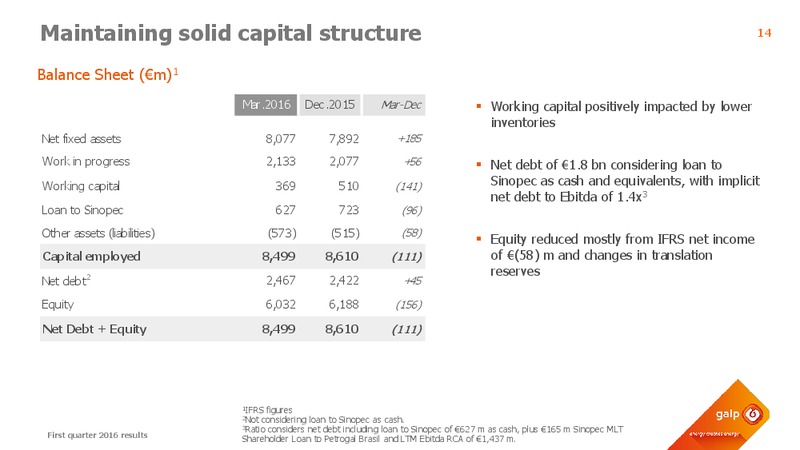
Maintaining solid capital structure 14 Balance Sheet (m)1 Mar.2016 Dec.2015 Mar-Dec Working capital positively impacted by lower inventories Net fixed assets 8,077 7,892 +185 Work in progress 2,133 2,077 +56 Net debt of 1.8 bn…
E&P: Net entitlement production up 39% YoY 16 Main E&P data 1Q15 4Q15 1Q16 QoQ YoY Brazilian production increased YoY, mainly due to FPSO 4 and FPSO 3 ramp-up Working interest production1 kboepd 41.5 52.1 56.3 +8% +36% Oil production…
R&M: Resilient Ebitda despite lower margins and volumes sold 17 Main R&M data 1Q15 4Q15 1Q16 QoQ YoY Refining margin of 4.1/boe following the lower margins in the international market Galp refining margin USD/boe 5.9 4.1 4.1 (2%)…
G&P: Ebitda down YoY on lower trading activity 18 Main G&P data 1Q15 4Q15 1Q16 QoQ YoY Trading volumes down YoY, with fewer opportunities in the international market NG supply total sales volumes mm3 2,195 1,692 1,860 +10% (15%)…
Investor Relations team 19 Pedro Dias, Head Otelo Ruivo, IRO Ctia Lopes Joo G. Pereira Results & presentation weblink : Joo P. Pereira www.galpenergia.com/en/investidor/Relatorios-e- resultados/resultados-trimestrais +351 21 724 08…
 Loading...