Third Quarter 2017 Earnings Call Materials November 3, 2017
Market Summary Ticker SOI Exchange New York Stock Exchange Share Price (1) 15.79 Diluted Shares Outstanding (1)(2) 44.1 million Market Capitalization 697 million (1) As of November 2, 2017. (2) Includes Class A and Class…
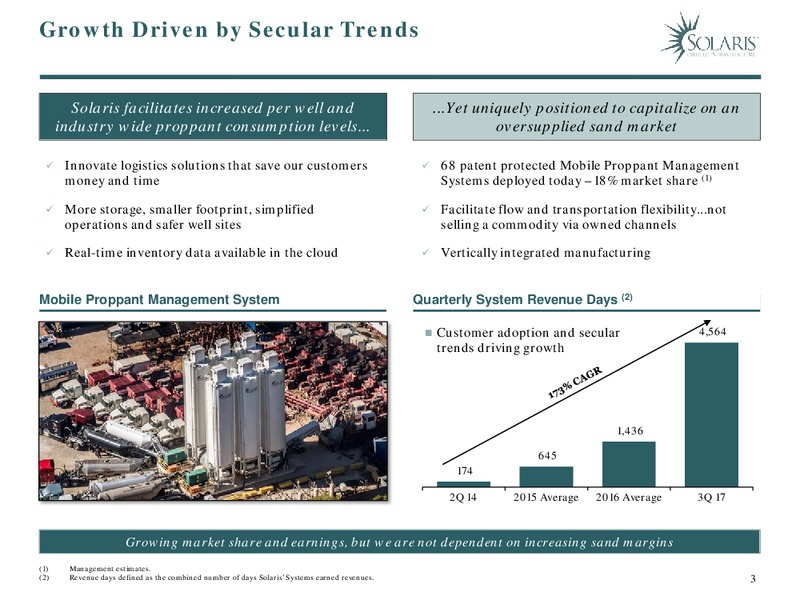
Growth Driven by Secular Trends Solaris facilitates increased per well and ...Yet uniquely positioned to capitalize on an industry wide proppant consumption levels... oversupplied sand market Innovate logistics solutions that save…
Leading Independent Provider of Proppant Logistics Solutions Mobile Fleet Active in Key Basins Well Site Systems Marcellus / Utica Mobile Proppant Management Systems addresses System 2 (3%) challenges related to the transportation,…
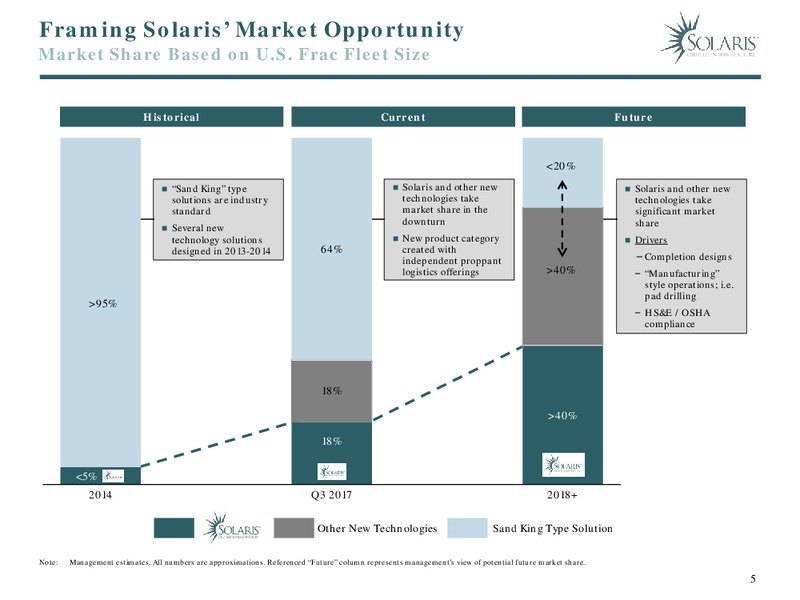
Framing Solaris Market Opportunity Market Share Based on U.S. Frac Fleet Size Historical Current…
Proppant Demand Continues to Increase New U.S. Horizontal Wells(1) Recovering commodity prices have driven increased drilling and completion activity 24.6 E&P operators have increasingly focused on using larger 19.4 amounts of…
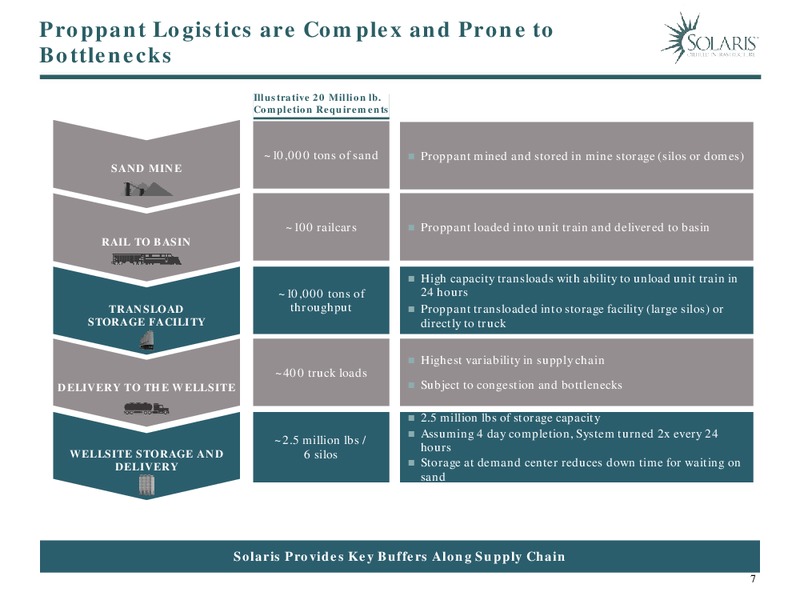
Proppant Logistics are Complex and Prone to Bottlenecks Illustrative 20 Million lb. Completion Requirements 10,000 tons of sand Proppant mined and stored in mine storage (silos or domes) SAND MINE 100 railcars Proppant loaded…
Bringing Order to Chaos Issues with Traditional Offerings Inadequate on-site inventory and offloading Traditional Rolling capacity Sand Kings Storage Complicated operations and expansive well site footprint Opaque inventory…
Elegant Solution to a Complicated Problem High Capacity Throughput Simple, modern, fully-integrated control system High volume input and output capacity Mobile and flexible equipment Supply Chain Savings Well Site Savings…
Kingfisher Facility Strategic Expansion into Transloading Logistics Development of a New High-Capacity Transload Facility Long-Term Contract with Leading STACK E&P Operator The first independent, high-speed, unit-train capable…
Continued Growth in Solaris Financial Performance Quarterly Revenue and Revenue Days ( in Millions) Q3 2017 Performance Commentary 18.5 3Q 2017 revenue and Adjusted EBITDA grew 38% and 50%, respectively, versus 2Q 2017 13.4 Growth…
Appendix 12
EBITDA and Adjusted EBITDA Reconciliation T hree m onths ended, ( in 0 0 0 s) Septem ber 30, 2017 June 30, 2017 March 31, 2017 Decem ber 31, 2016 Net income (loss) 7 ,406 1 ,062 4,7 82 3,024 Depreciation and amortization 1 ,7 42 1…
 Loading...