Why Imperial Distinct competitive advantages that deliver long-term value Asset base Growth opportunities High quality, high performing assets A large inventory of attractive opportunities across the portfolio to support future…
Company priorities Disciplined focus on performance, execution and creating value Base business fundamentals + Maximizing asset performance + Capturing cost and organizational efficiencies Progressing growth opportunities +…
Scope of operations Nationwide leadership across the full value chain Kearl mining Research Syncrude mining Sarnia refinery Rail terminal Cold Lake in situ Sarnia chemical Strathcona refinery Nanticoke refinery Fuels…
Integration & synergies Delivering competitive advantage in all business lines Equity crude placed in Upstream highest netback markets Oil & natural gas production Cost-advantaged feedstocks for refineries & chemical IMO / XOM…
Technology leadership Unparalleled commitment, history of research and innovation Canadas first Cyclic steam Steam-assisted Solvent assisted research stimulation gravity drainage technology patent department patent pilots IMO 1…
Financial performance Demonstrating value of integration through the business cycle Cash flow from operating activities, C billion Five-year average1, % 5 4 3 Upstream Downstream & other 2 1 0 2012 2013 2014 2015 2016 1For the…
Capital efficiency Maximizing investment value and life cycle performance Return on capital employed, % 25 10-year average1 3-year average1 15 5 -5 IMO HSE CNQ SU CVE Source: company publications 1For the years ended 2016…
Financial strength Strong balance sheet, priority access to financial markets Debt to capital, % 40 30 Leverage XOM relationship 20 Borrow on most attractive terms 10 Optimize use of floating rate debt 0 Maintain capital structure…
Shareholder distributions 10 billion returned to shareholders in the last 10 years 2007-16 average payout ratio1, % 2007-16 total distributions, C billion IMO SU HSE HSE CVE IMO SU CNQ CNQ CVE 0 5 10 15 20 25 30 35 0 3 6 9 12…
Dividends and buybacks Proven history of returning cash and preserving value Dividend per share1, C 0.60 100+ years of consecutive payment 0.40 22 years of consecutive growth 6.3% 10-yr compounded growth rate 0.20 Repurchased 50%…
Capital expenditures Recently completed growth, evaluating future opportunities Annual average, C billion 6 5 Kearl, Nabiye projects complete + Added nearly 200 kbd capacity 4 3 Sustaining capex under C1B annually + Down 30+% from…
Financial resilience Strength provides flexibility under a range of oil prices 2016-20 annual average, C billion 4 55 3 Ability to meet highest priorities 2 45 Significant cash flow leverage Growth Options to pursue growth 1…
Upstream portfolio Completing period of unprecedented liquids growth In situ Production, kbd Cold Lake Record high liquids production in 2016 500 Growth portfolio Highest total production since 1993 400 Mining Kearl Syncrude 300…
Cold Lake: world-class in situ operation Best-in-class operational performance Cyclic steam 100% IMO Producing stimulation owned since 1985 1.7B 165 bbls kbd 2P reserves1 average production1 Large, high quality bitumen resource…
Continuously improving resource recovery Achieved through technology, innovation and best practices Cold Lake demonstrated recovery, % 80 2010+ 60 2000s 40 1990s 1980s 20 1970s 0 Thermal Pilots Commercialization of Megarow…
Achieving lower cost per barrel Mature, lean asset continuing to see improvements Unit cash opex, US Production1, kbd 2015 industry unit cash opex, C indexed % 100 180 75 120 Cold Lake 50 60 25 0 0 0 5 10 15 20 2014 2015 2016…
Kearl: next generation oil sands mining Driving operational performance and synergies Mining without 71% IMO Producing upgrader owned since 2013 3.3B 220 bbls kbd 2P reserves1 targeted production2 Large, high-quality bitumen…
Proprietary froth treatment Producing pipeline-quality bitumen without an on-site upgrader + Diluent Kearl Bitumen Dilbit Paraffinic froth treatment Sediment & water Refinery Asphaltenes Other mines Bitumen Synthetic crude…
Achieving lower cost per barrel Cost discipline, economies of scale fundamental to success Unit cash opex, US Production1, kbd indexed % 100 150 75 More than 50% reduction in unit opex 100 50 Expansion benefiting cost profile 50…
Enhancement opportunities Activities focused on efficient capacity creep Existing scope Implementation of operational learnings to enhance capacity Incremental scope and optimize asset Equipment upgrades and utilities integration to…
Syncrude: pioneer of oil sands mining Improvement underway to capture full potential Mining with 25% IMO Producing upgrader owned since 1978 1.1Bbbls 76kbd 2P reserves1 average production1 High value, synthetic crude production…
Reliability improvement Performance driven by execution of long-term strategic plan Production1, kbd Impact of fire & turnarounds 90 Reliability risk management 60 Planning and execution excellence 30 Focus on upgrader…
Enhancement opportunities Leveraging existing and owner-driven oil sands expertise Reliability Utilization of expertise, competency and equipment Synergy strategies to enhance performance Identify further opportunities to leverage…
Sustainable, structural savings Driving upstream costs down with continuous improvement Continued market capture Scope, structure and technology Ongoing rate, term negotiation Innovative, efficient new work approaches Expanded…
Upstream resources Large, high quality resource base with significant potential In situ Year-end 2016 resource base, billion boe1 Aspen 16 Cold Lake Exp. Growth portfolio 12 30+ years Mining proved reserves2 Non-aqueous extraction…
In situ growth portfolio Multiple opportunities, development planning ongoing Resource potential 0.8 billion barrels 2P Reserves1 4.6 billion barrels Contingent Resources1,2 Enabling technology SA-SAGD / other solvent technologies…
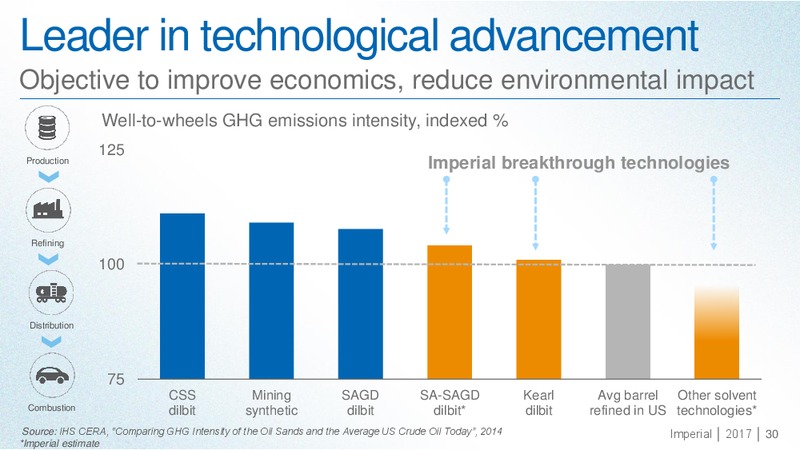
Leader in technological advancement Objective to improve economics, reduce environmental impact Well-to-wheels GHG emissions intensity, indexed % 125 Production Imperial breakthrough technologies Refining 100…
In situ technology advancements SA-SAGD provides step-change improvement opportunity Pilot results, indexed % 100 SAGD Industry 75 Economic, environmental gains SA- SAGD IMO Ability to scale efficiently 50 Technology ready to…
Downstream & Chemical portfolio Operational excellence and integration drive performance Refining Operations, % Volumes, kbd Nanticoke Impact of turnarounds Sarnia 100 500 Strathcona 10-year 75 2016 Marketing avg Esso Mobil 1 50…
Strong Downstream & Chemical cash flow More than 12.5 billion net cash generated since 2011 Net cash, C billion Retail sale proceeds 4 Resilient cash generating capabilities Continued structural advantages 2 Low sustaining…
Refining: efficient, value-driven business Integration elevates advantage in mature industry Nanticoke, Sarnia, Strathcona, Ontario Ontario Alberta 421 kbd 95 percent refining capacity 4Q16 utilization Well-positioned,…
Downstream enhancements Evaluating further value creation Cogeneration Strathcona Earliest FID 2017 Capture gas-power spread More efficient steam Leverage carbon tax credits Diluent Recovery Unit Strathcona Timing to be…
Rail terminal Strategic asset provides options to reach high value markets Edmonton, Location Start-up April Alberta advantage 2015 Joint 210K venture bbl/d with Kinder gross Morgan capacity Equity crude flow assurance…
Fuels & Lubes: marketing excellence Delivering valued products to customers nationwide Wholesale Commercial Industrial 1,700 + 484 Esso kbd retail sites 2016 sales Focused on premium markets High capability distributor…
Retail conversion Committed to enhance retail offering and grow value Existing, successful Fuel technology partnerships development Long-term supply Customer experience agreements enhancements Commitment to grow Standardized…
Chemical: unique, commodity business One of Canadas leading producers of chemical products Sarnia, Refinery Location Ontario integration advantage 908 187 kt million 2016 sales 2016 earnings Top-tier asset, specialty customers…
Why Imperial Distinct competitive advantages that deliver long-term value Asset base Growth opportunities High quality, high performing assets A large inventory of attractive opportunities across the portfolio to support future…
For more information: imperialoil.ca Twitter YouTube LinkedIn Investor Relations T: +1 (587) 476-3115 E: investor.relationsesso.ca Imperial Oil 505 Quarry Park Blvd SE Calgary, Alberta T2C 5N1
IMO at a glance Delivering superior, long-term shareholder value 2016 3-yr average Cash from operations (B) 2.0 2.9 848M Shares 36B Net income (B) 2.2 2.4 Market cap outstanding (2016) ROCE (%) 7.1 8.2 (2016) Capex (B) 1.2 3.5…
 Loading...