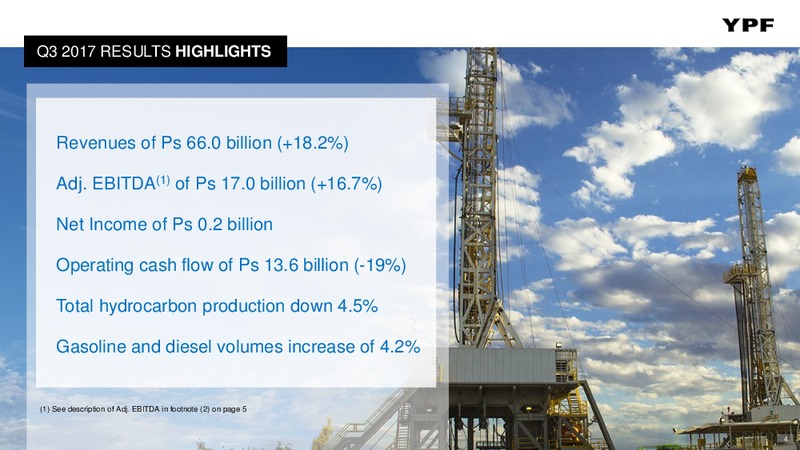
Q3 2017 RESULTS HIGHLIGHTS Revenues of Ps 66.0 billion (+18.2%) Adj. EBITDA(1) of Ps 17.0 billion (+16.7%) Net Income of Ps 0.2 billion Operating cash flow of Ps 13.6 billion (-19%) Total hydrocarbon production down 4.5%…
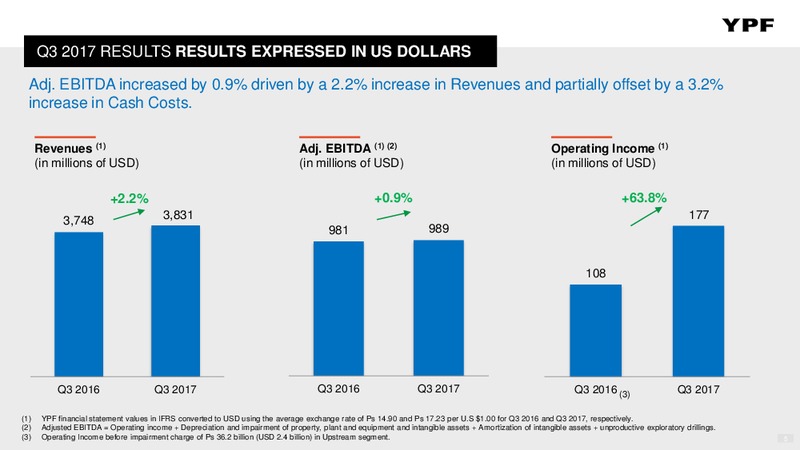
Q3 2017 RESULTS RESULTS EXPRESSED IN US DOLLARS Adj. EBITDA increased by 0.9% driven by a 2.2% increase in Revenues and partially offset by a 3.2% increase in Cash Costs. Revenues (1) Adj. EBITDA (1) (2) Operating Income (1) (in…
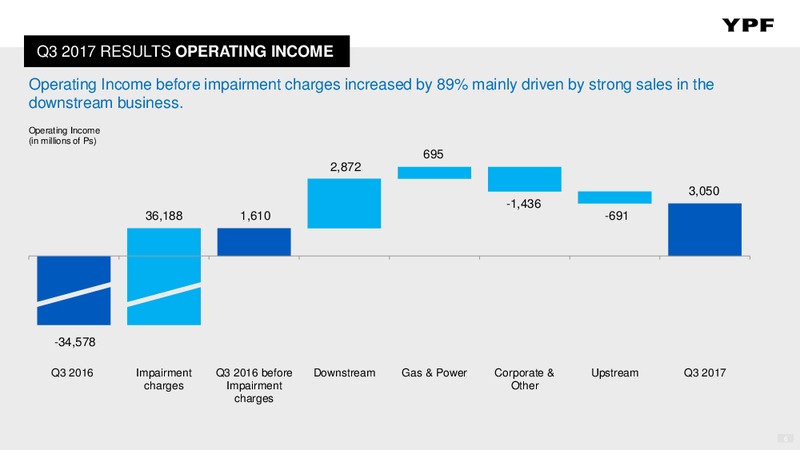
Q3 2017 RESULTS OPERATING INCOME Operating Income before impairment charges increased by 89% mainly driven by strong sales in the downstream business. Operating Income (in millions of Ps) 695 2,872 3,050 -1,436 36,188 1,610…
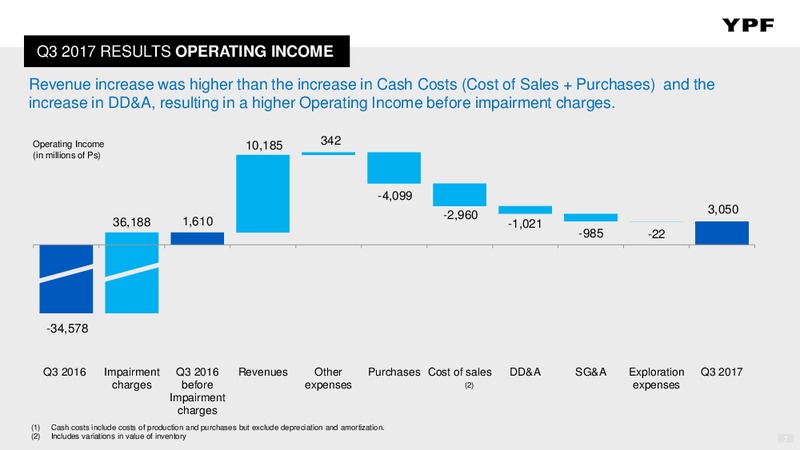
Q3 2017 RESULTS OPERATING INCOME Revenue increase was higher than the increase in Cash Costs (Cost of Sales + Purchases) and the increase in DD&A, resulting in a higher Operating Income before impairment charges. Operating Income…
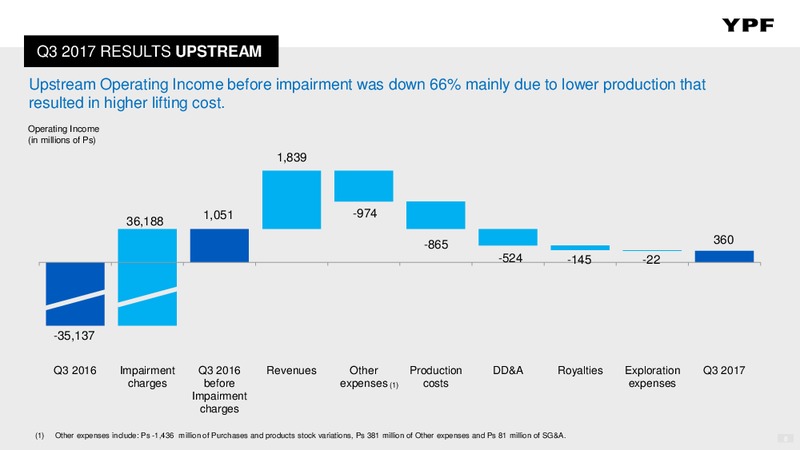
Q3 2017 RESULTS UPSTREAM Upstream Operating Income before impairment was down 66% mainly due to lower production that resulted in higher lifting cost. Operating Income (in millions of Ps) 1,839 1,051 -974 36,188 -865 360 -524…
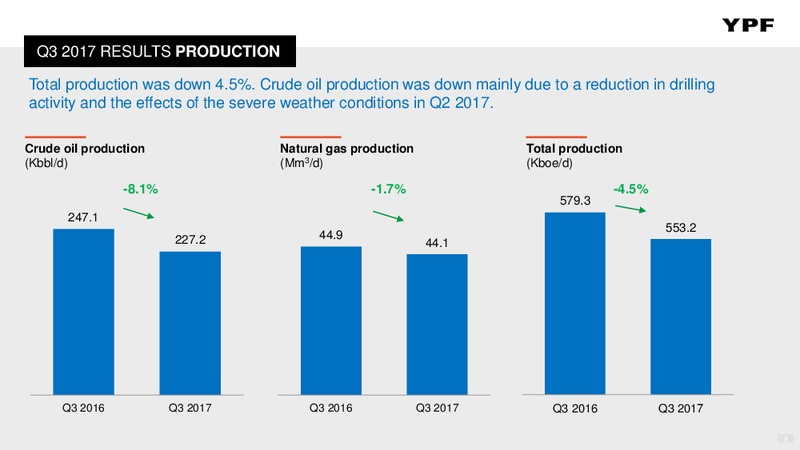
Q3 2017 RESULTS PRODUCTION Total production was down 4.5%. Crude oil production was down mainly due to a reduction in drilling activity and the effects of the severe weather conditions in Q2 2017. Crude oil production Natural gas…
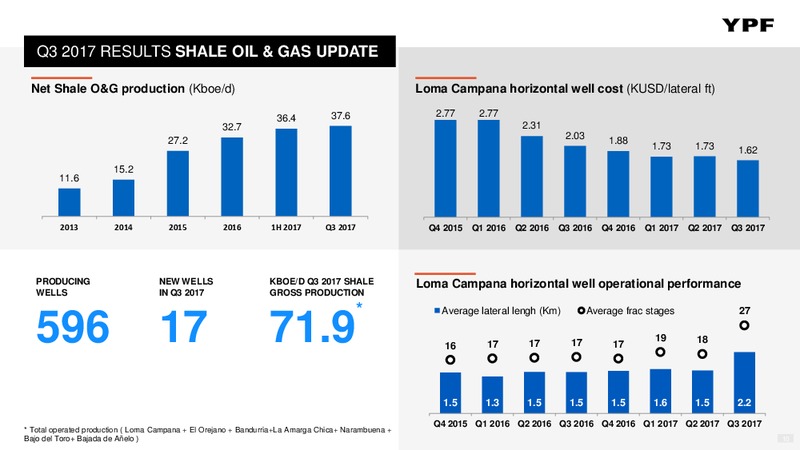
Q3 2017 RESULTS SHALE OIL & GAS UPDATE Net Shale O&G production (Kboe/d) Loma Campana horizontal well cost (KUSD/lateral ft) 37.6 2.77 2.77 36.4 32.7 2.31 27.2 2.03 1.88 1.73 1.73 1.62 15.2 11.6 2013 2014 2015 2016 1H 2017…
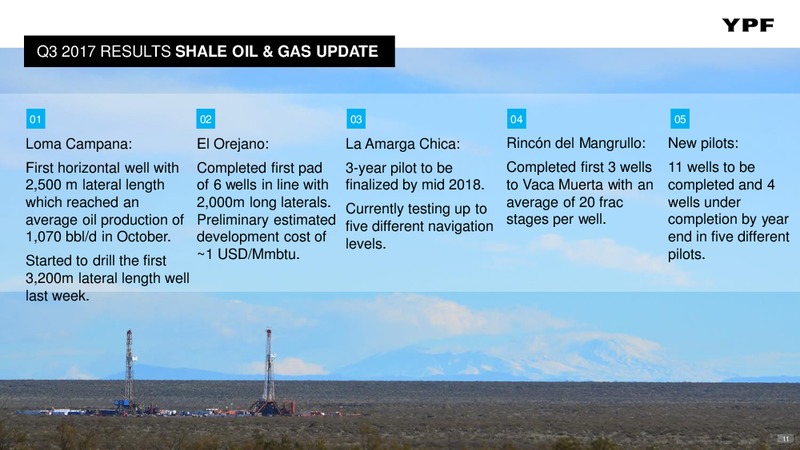
Q3 2017 RESULTS SHALE OIL & GAS UPDATE 01 02 03 04 05 Loma Campana: El Orejano: La Amarga Chica: Rincn del Mangrullo: New pilots: First horizontal well with Completed first pad 3-year pilot to be Completed first 3 wells 11 wells to…
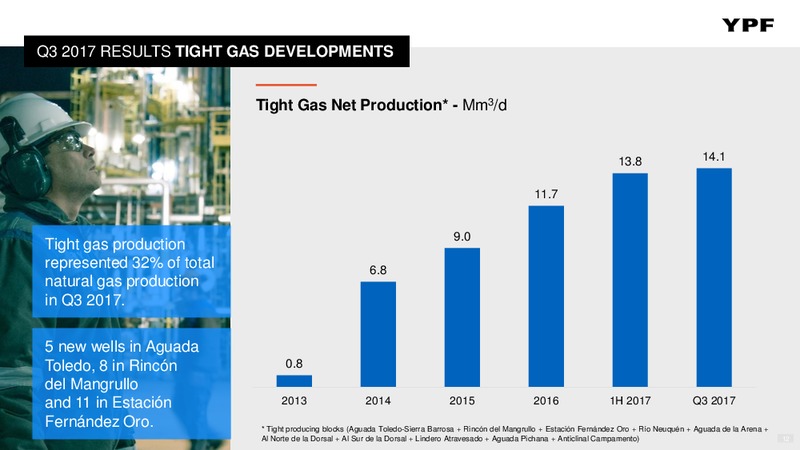
Q3 2017 RESULTS TIGHT GAS DEVELOPMENTS Tight Gas Net Production* - Mm3/d 13.8 14.1 11.7 9.0 Tight gas production represented 32% of total 6.8 natural gas production in Q3 2017. 5 new wells in Aguada Toledo, 8 in Rincn 0.8…
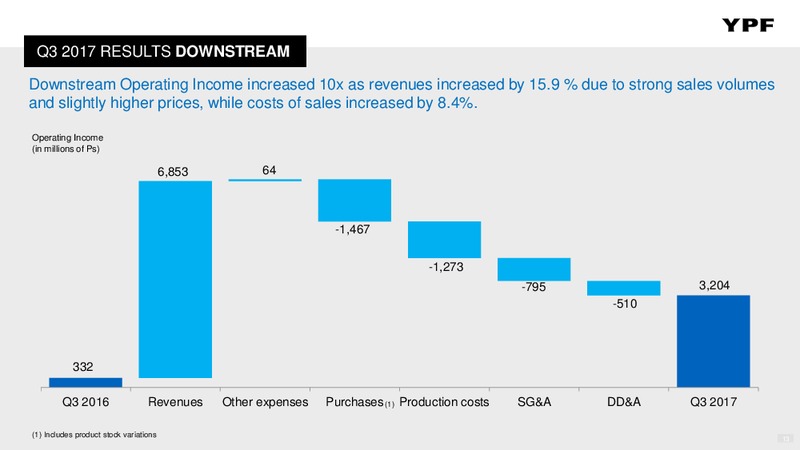
Q3 2017 RESULTS DOWNSTREAM Downstream Operating Income increased 10x as revenues increased by 15.9 % due to strong sales volumes and slightly higher prices, while costs of sales increased by 8.4%. Operating Income (in millions of Ps)…
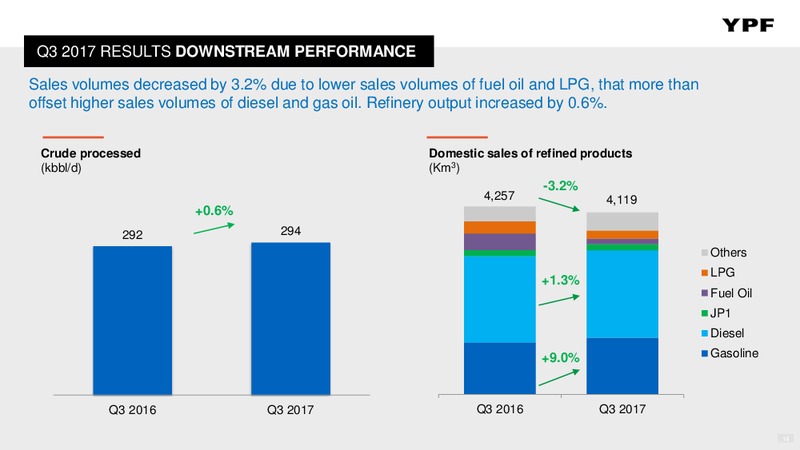
Q3 2017 RESULTS DOWNSTREAM PERFORMANCE Sales volumes decreased by 3.2% due to lower sales volumes of fuel oil and LPG, that more than offset higher sales volumes of diesel and gas oil. Refinery output increased by 0.6%. Crude…
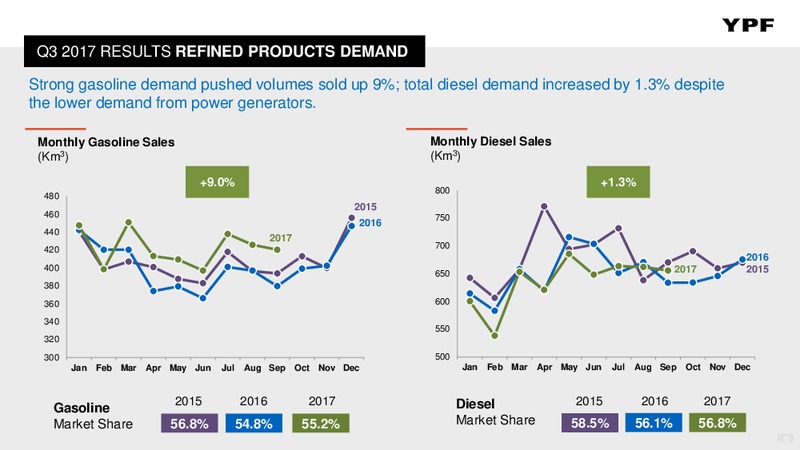
Q3 2017 RESULTS REFINED PRODUCTS DEMAND Strong gasoline demand pushed volumes sold up 9%; total diesel demand increased by 1.3% despite the lower demand from power generators. Monthly Gasoline Sales Monthly Diesel Sales (Km3) (Km3)…
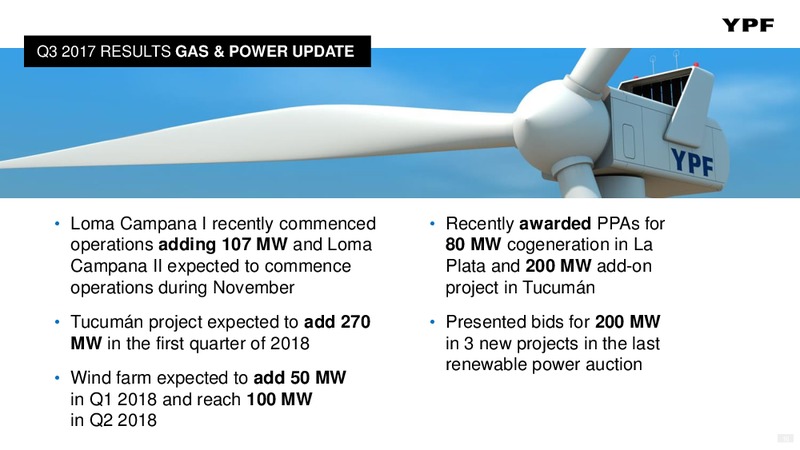
Q3 2017 RESULTS GAS & POWER UPDATE Loma Campana I recently commenced Recently awarded PPAs for operations adding 107 MW and Loma 80 MW cogeneration in La Campana II expected to commence Plata and 200 MW add-on operations during…
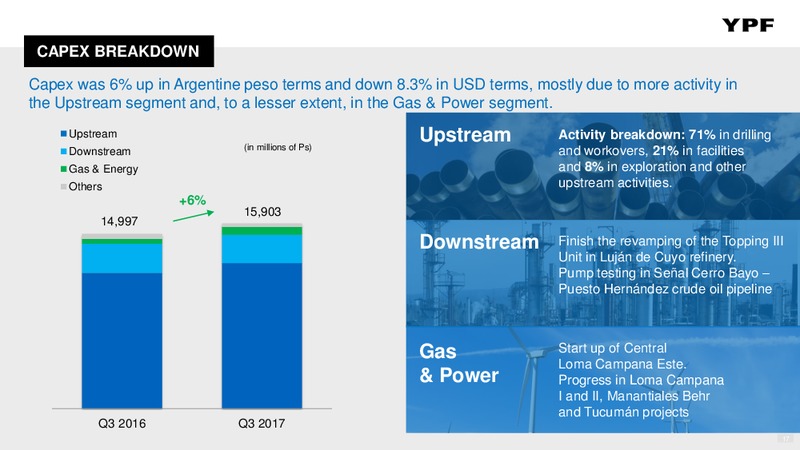
CAPEX BREAKDOWN Capex was 6% up in Argentine peso terms and down 8.3% in USD terms, mostly due to more activity in the Upstream segment and, to a lesser extent, in the Gas & Power segment. Upstream (in millions of Ps) Upstream…
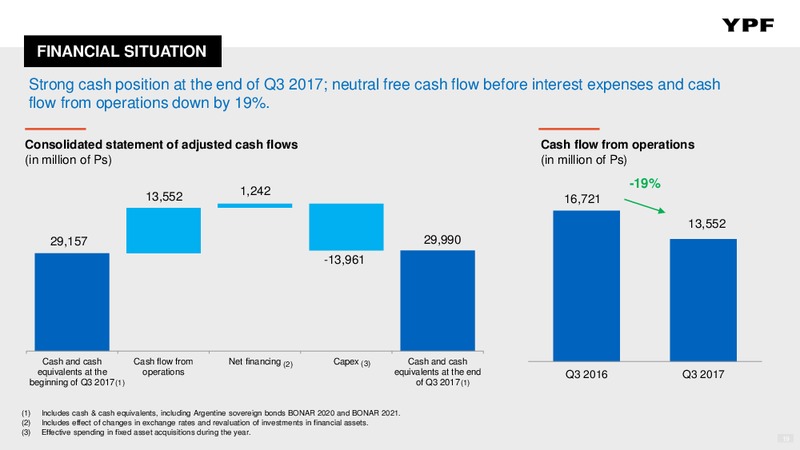
FINANCIAL SITUATION Strong cash position at the end of Q3 2017; neutral free cash flow before interest expenses and cash flow from operations down by 19%. Consolidated statement of adjusted cash flows Cash flow from operations (in…
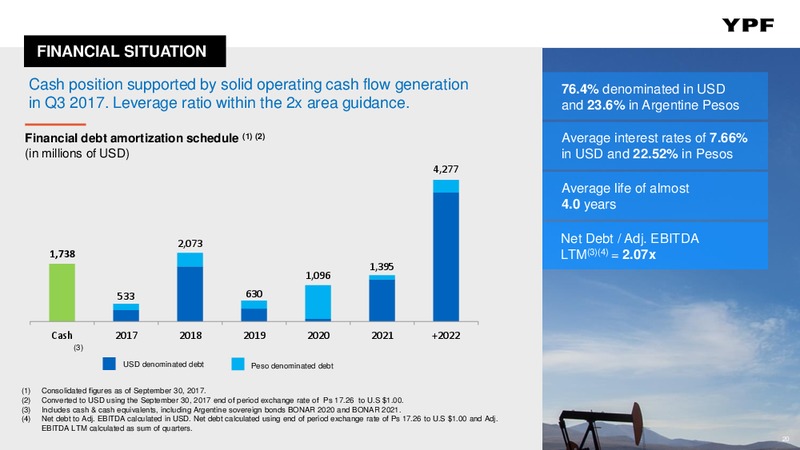
FINANCIAL SITUATION Cash position supported by solid operating cash flow generation 76.4% denominated in USD in Q3 2017. Leverage ratio within the 2x area guidance. and 23.6% in Argentine Pesos Financial debt amortization schedule…
SUMMARY Strong quarter in line with expectations; reaffirming guidance Thriving economy is resulting in continued demand growth for all our products Important recovery in prices for crude oil and fuels Disappointing outcome of new…
Questions and Answers 3rd Quarter Earnings Webcast 23
3rd QUARTER 2017 EARNINGS WEBCAST November 09, 2017
 Loading...