CANBRIAM ENERGY INC. CORPORATE PRESENTATION FEBRUARY 2018
Canbriam Energy An integrated, BC Montney natural gas growth company with differentiated resource quality Private company focused in the prolific Montney Birch formation in northeast BC 100% owned & operated processing…
Investing in Canbriam Energy Canbriams integrated approach supports low cost Montney development & full cycle value creation Prolific BC Montney asset Large, low risk, high return drilling inventory Integrated strategy…
Canbriams Altares is located in the northern extension of the Montney The prolific BC Montney has significant well density and peer activity Canbriam Energy Williston Lake 15 km 4 Canbriam Energy Corporate presentation
Consolidating a premier BC Montney land position Transformational land transaction(1) announced February 8; expected to close in Q1 2018 Birch Benefits of transaction include: 1. Combined acreage supports scalable, low cost growth…
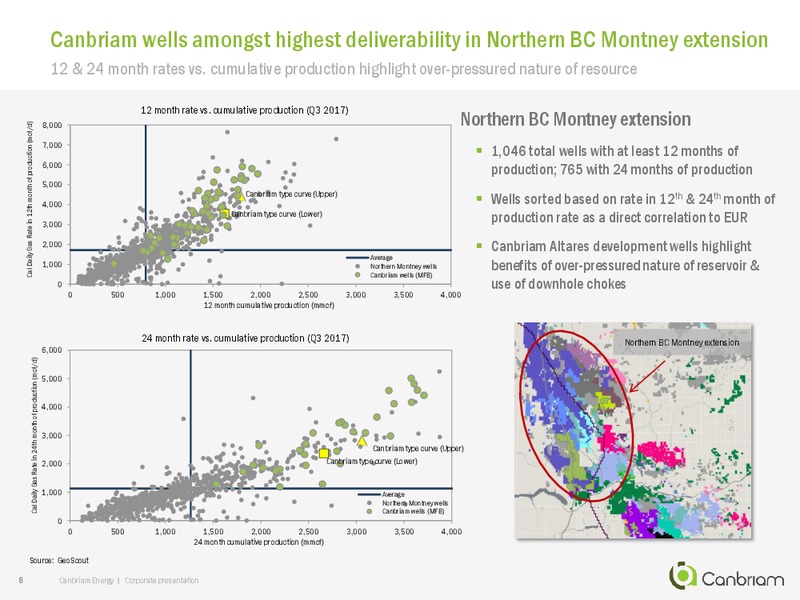
Canbriam wells amongst highest deliverability in Northern BC Montney extension 12 & 24 month rates vs. cumulative production highlight over-pressured nature of resource 12 month rate vs. cumulative production (Q3 2017) 8,000 Northern…
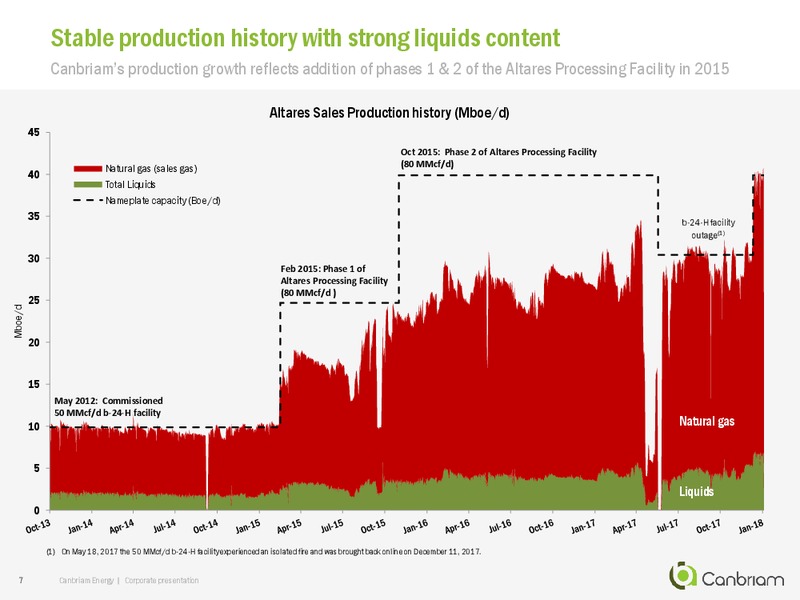
Stable production history with strong liquids content Canbriams production growth reflects addition of phases 1 & 2 of the Altares Processing Facility in 2015 Altares Sales Production history (Mboe/d) 45 Oct 2015: Phase 2 of Altares…
Increased drilling & completion efficiency in over-pressured Montney Canbriams Altares drilling requires underbalanced drilling with mud weights exceeding 1,800 kg/m3 Unique challenges in over-pressured Doig & Montney formations (18…
Positioned within the liquids rich fairway of the BC Montney Large, contiguous land position in Altares & Kobes supports liquids rich natural gas development Dry gas Rich gas Oil window 0-10 bbl/MM 10 -100 bbl/MM 100+ bbl/MM Strong…
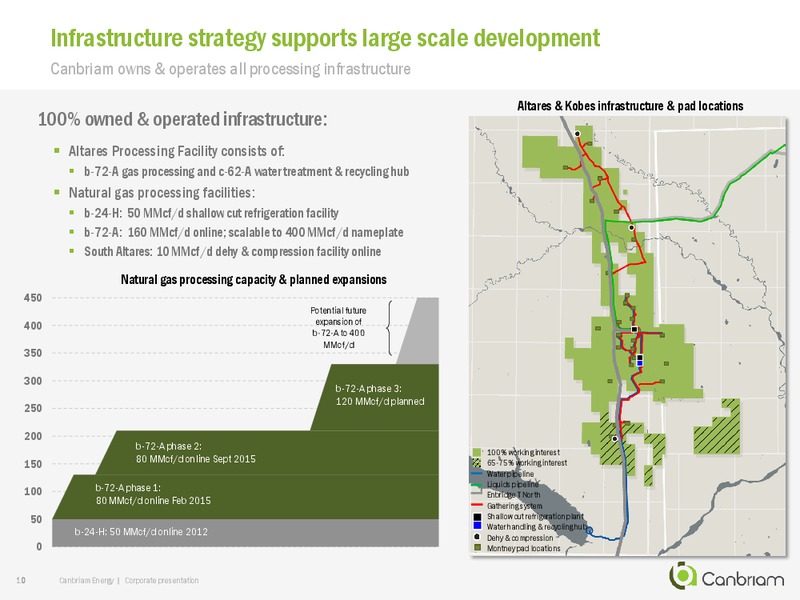
Infrastructure strategy supports large scale development Canbriam owns & operates all processing infrastructure Altares & Kobes infrastructure & pad locations 100% owned & operated infrastructure: Altares Processing Facility…
Altares Processing Facility: scalable to 400 MMcf/d Canbriam owns & operates all processing infrastructure Water treatment & recycling hub Commissioned March 2015 Phase 4: 120 MMcf/d Sanctioning to be determined Phase 3: 120…
Competitively advantaged in water sourcing, handling & disposal Integrated water strategy eliminates need to truck water Sourcing & distribution 80% 20 year permit (2011) to access 10,000 m3/day of fresh water from Williston Lake…
Marketing & transportation plan supports long term development Sufficient takeaway capacity to support near term requirements Enbridge T North: 228 MMcf/d firm capacity Enbridge T North Actively mitigating unused firm capacity…
Northern B.C. Natural gas pipeline and takeaway capacity Growing egress solutions expected to support B.C. Montney development Current Potential Expected Pipeline capacity expansion Jedney timing(1) (Bcf/d) (Bcf/d) Birley…
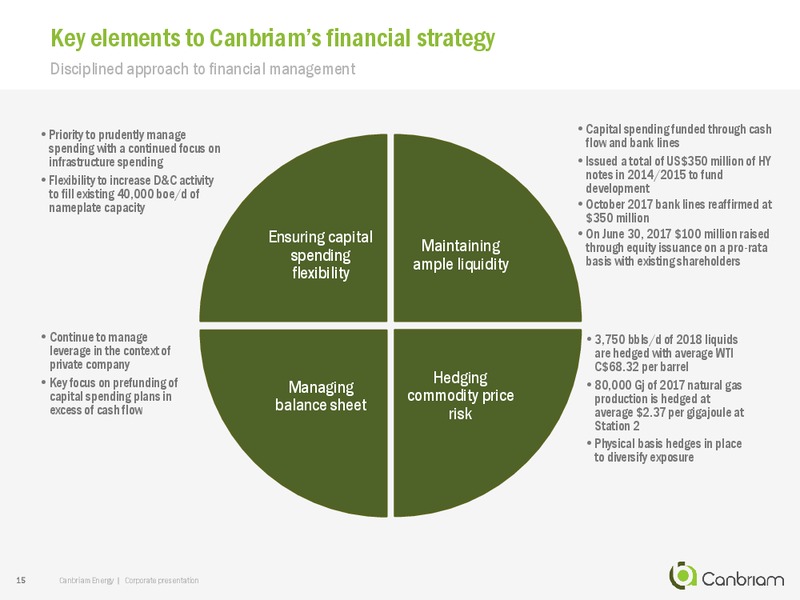
Key elements to Canbriams financial strategy Disciplined approach to financial management Priority to prudently manage Capital spending funded through cash spending with a continued focus on flow and bank lines infrastructure…
Managing Station 2 pricing Active hedging, physical sales basis contracts & high heat content have optimized natural gas pricing Natural gas hedges (at January 31, 2018) M Gj/d High heat content natural gas(1) 120 3.50 100 3.00…
Managing Station 2 pricing Disciplined approach to risk management has helped optimize natural gas pricing Physical delivery sales contracts (Gj/d) Regional price exposure 2018E Physical contracts(1) Hub 2018 expiry 2019 expiry…
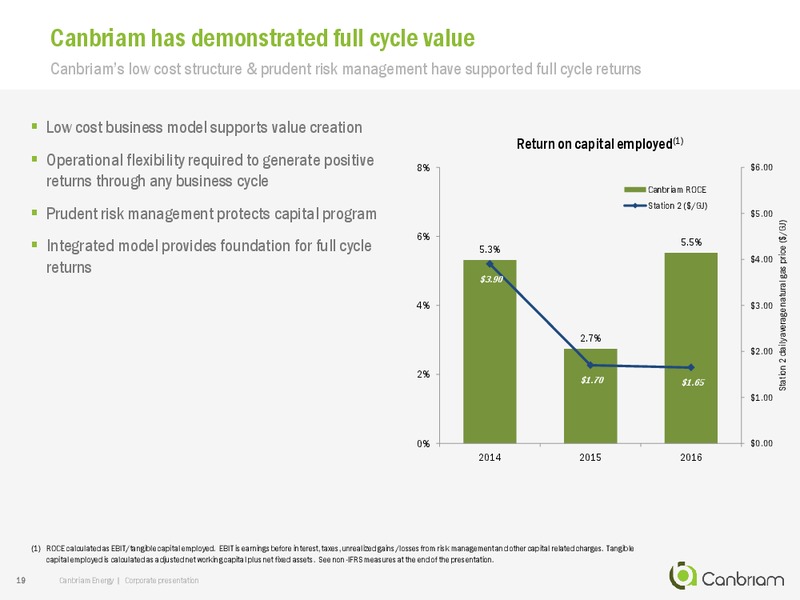
Canbriam has demonstrated full cycle value Canbriams low cost structure & prudent risk management have supported full cycle returns Low cost business model supports value creation Return on capital employed(1) Operational…
Investing in Canbriam Energy A fully integrated, natural gas growth company with differentiated resource quality 1,100 of Montney vertical thickness on 187,000 (60% liquids rich) net acres 225.6 MMboe of gross 1P Reserves (pre-tax…
SUPPLEMENTAL INFORMATION 21 Canbriam Energy Corporate presentation
Canbriam has the foundation for long term value creation Our approach is defined by three key elements Resource Innovation Collaboration Montney is a world class reservoir Canbriams success is tied to early Team approach fosters…
Canbriam Energy leadership Team built specifically for exploration & development of unconventional gas resource Paul Myers Founder and CEO since company inception in 2008 President and Chief Diverse 30 year career in various…
Over-pressured Altares Montney supports high well deliverability Altares Montney demonstrates anomalous over-pressure Canbriam pressure gradient (kPa/meter) Up to 2 times over pressured within Altares Montney Downhole choke strategy…
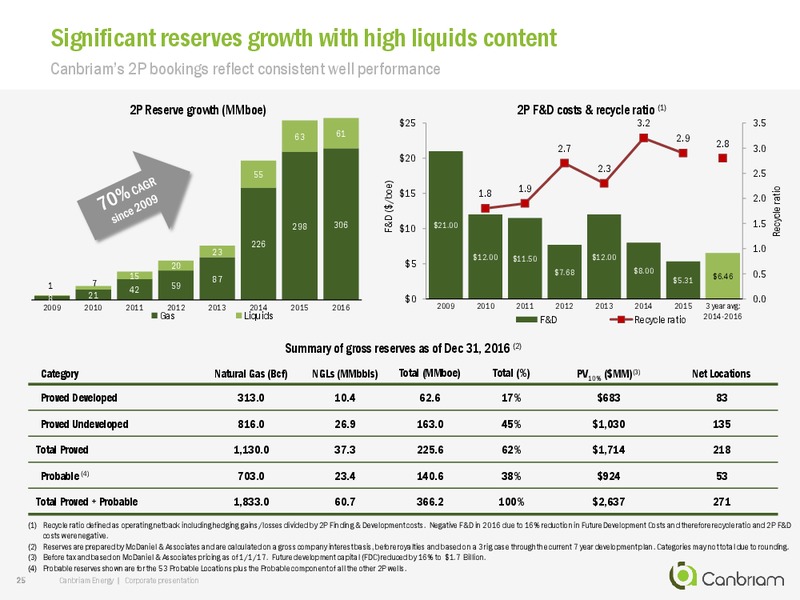
Significant reserves growth with high liquids content Canbriams 2P bookings reflect consistent well performance 2P Reserve growth (MMboe) 2P F&D costs & recycle ratio (1) 25 3.2 3.5 63 61 2.9 2.8 2.7 3.0 20 2.3 2.5 55 F&D…
Illustrative type curve economics Main Fault Block Type well statistics represent the current planning basis for Canbriam Single well statistics Main Fault Block Upper Montney Lower Montney Well properties Raw gas type curve…
Improving decline rates through downhole choke management Sustaining capital requirement is 90 million annually to maintain 40,000 boe/d of production capacity Production by well vintage 35,000 27% H2 2017 H1 2017 Q217: Road…
Optimizing well performance through choke management strategy Canbriams use of downhole chokes optimizes its over-pressured reservoir Altares c-B27-H well - Upper Montney Advantages of downhole chokes: 15.0 30,000 Minimizes 1st…
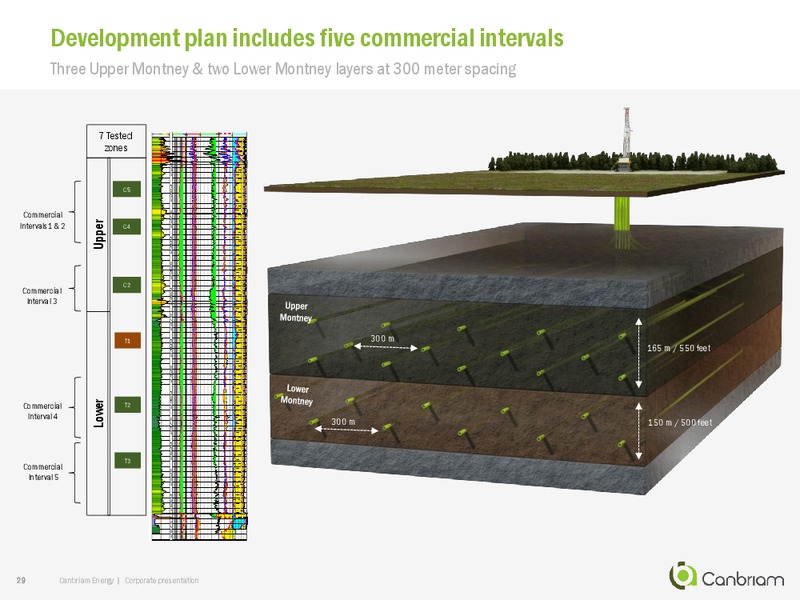
Development plan includes five commercial intervals Three Upper Montney & two Lower Montney layers at 300 meter spacing 7 Tested zones C5 Commercial Upper Intervals1 & 2 C4 C2 Commercial Interval 3 T1 300 m…
Efficiency gains tied to improved drilling & completion performance Cost efficiency tied to sliding sleeve technology, less intense completions & improved drill times Drilling, completion & equipment / tie-in costs by well Current…
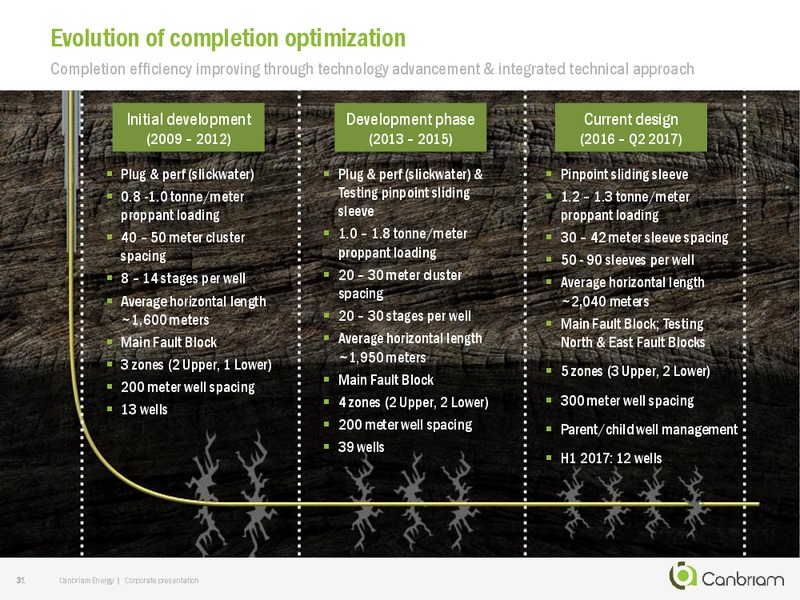
Evolution of completion optimization Completion efficiency improving through technology advancement & integrated technical approach Initial development Development phase Current design (2009 2012) (2013 2015) (2016 Q2 2017) Plug &…
Development plan focused in the prolific Main Fault Block Canbriams Main Fault Block is substantially de-risked and represents the majority of the next 5 years development Daily Raw Gas Production by Well Upper Montney Development…
Stable production history with strong liquids content Canbriams production growth reflects addition of phases 1 & 2 of the Altares Processing Facility in 2015 250 Inlet Sep Natural gas production 40,000 Boe/d nameplate capacity 200…
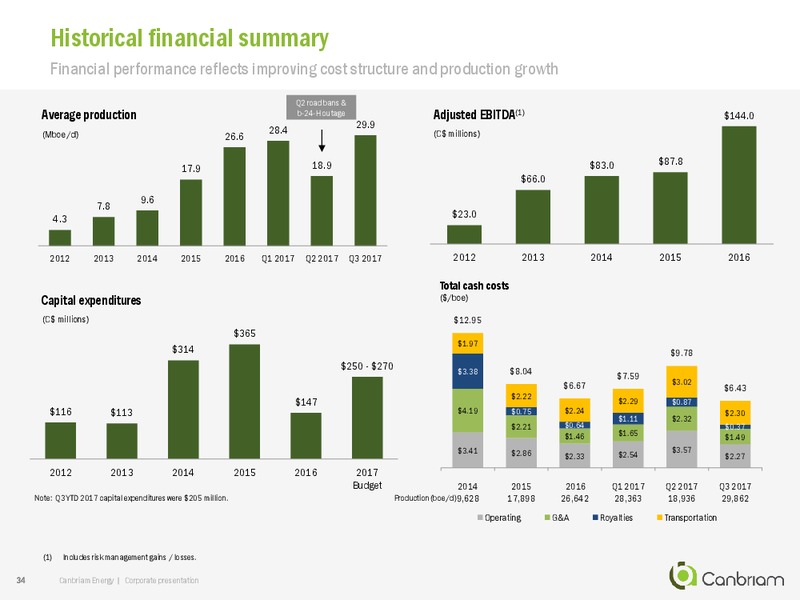
Historical financial summary Financial performance reflects improving cost structure and production growth Q2 road bans & Average production b-24-H outage Adjusted EBITDA(1) 144.0 29.9 (Mboe/d) 28.4 (C millions) 26.6 18.9 83.0…
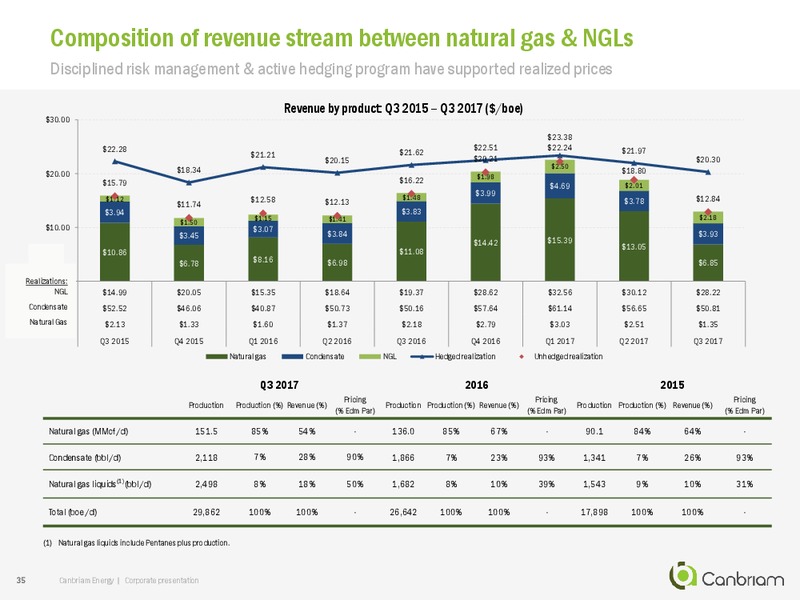
Composition of revenue stream between natural gas & NGLs Disciplined risk management & active hedging program have supported realized prices Revenue by product: Q3 2015 Q3 2017 (/boe) 30.00 23.38 22.28 22.51 22.24 21.97 21.21…
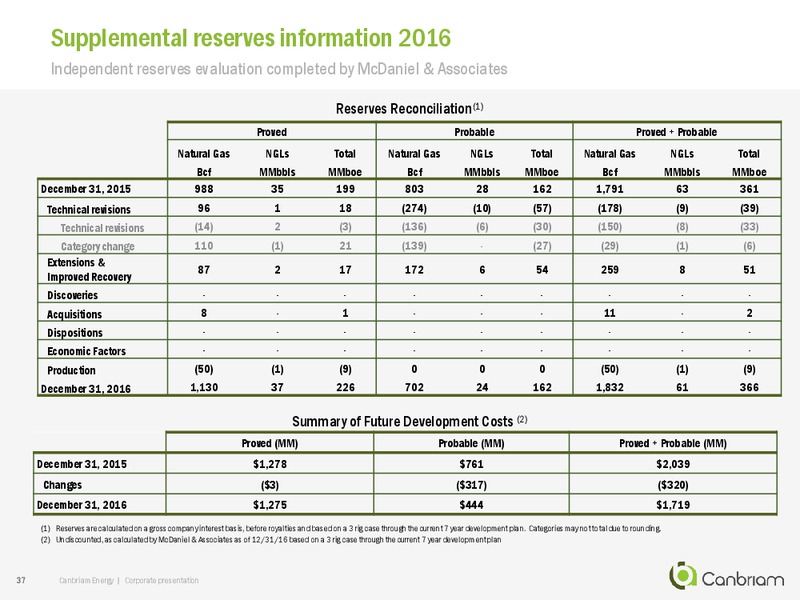
Supplemental reserves information 2016 Independent reserves evaluation completed by McDaniel & Associates Reserves Reconciliation(1) Proved Probable Proved + Probable Natural Gas NGLs Total Natural Gas NGLs Total Natural Gas NGLs…
Canbriam Energy Inc. 2100, 215 2nd Street SW Calgary, AB Canada T2P 1M4 Tel: 403.269.2874 www.canbriam.com Paul Myers President & Chief Executive Officer 403.718.8550 pmyerscanbriam.com Rob Froese Chief Financial Officer 403.718.3601…
 Loading...