Impact of Technology on Business Model INVESTOR PRESENTATION 2018 5
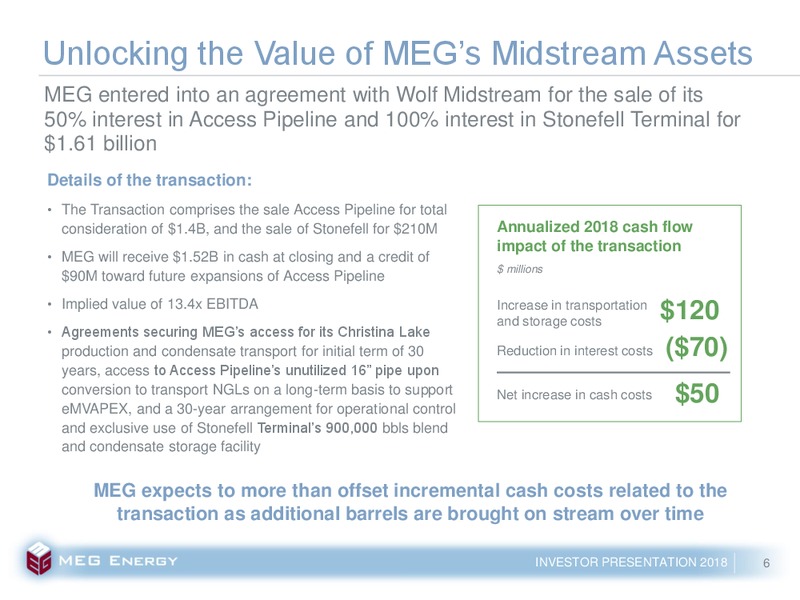
Unlocking the Value of MEGs Midstream Assets MEG entered into an agreement with Wolf Midstream for the sale of its 50% interest in Access Pipeline and 100% interest in Stonefell Terminal for 1.61 billion Details of the transaction: The…
Sources & Uses of Proceeds from Divestiture The transaction allows MEG to substantially pay down debt, pursue highly-economic growth projects, ensure future transportation/storage needs are met, while protecting the companys competitive…
Pro Forma Maturity Profile Divestiture of the Access Pipeline significantly improves MEGs financial position INVESTOR PRESENTATION 2018 8
2018 Capital and Operational Guidance Capital Investment Plan Operational Guidance millions eMSAGP growth capital 120 4.75 to eMVAPEX and future growth capital 100 5.25 per barrel Non-energy operating costs Sustaining and…
High-Return, Short-Cycle Growth Fully funded near-term opportunities to grow Christina Lake production to 113 kbpd Phase 2B eMSAGP Growth eMSAGP is a reservoir enhancement technology involving the injection of a non-condensable gas and…
Impact of Growth on Leverage Growth to 113,000 bpd by early 2020 contribute to higher margins, along with proceeds from divestiture of midstream assets, significantly improves the companys leverage position Based on US60 WTI*, pro forma…
eMSAGP* Model A Modification of SAGD Inject non-condensable gas (NCG) 2 Warmed bitumen Freed-up steam 1 3 to maintain reservoir pressure, is pushed toward is re-diverted to reducing steam injection by 50% infill well by pressure…
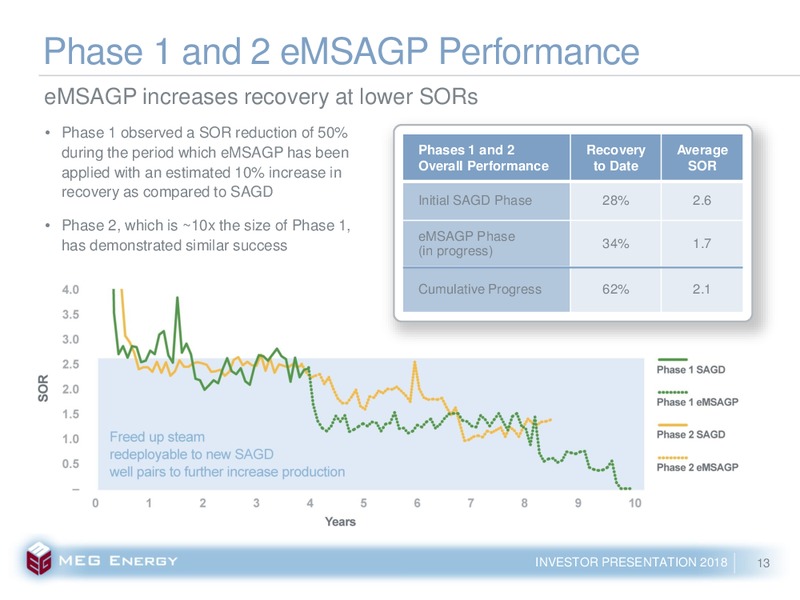
Phase 1 and 2 eMSAGP Performance eMSAGP increases recovery at lower SORs Phase 1 observed a SOR reduction of 50% during the period which eMSAGP has been Phases 1 and 2 Recovery Average applied with an estimated 10% increase in Overall…
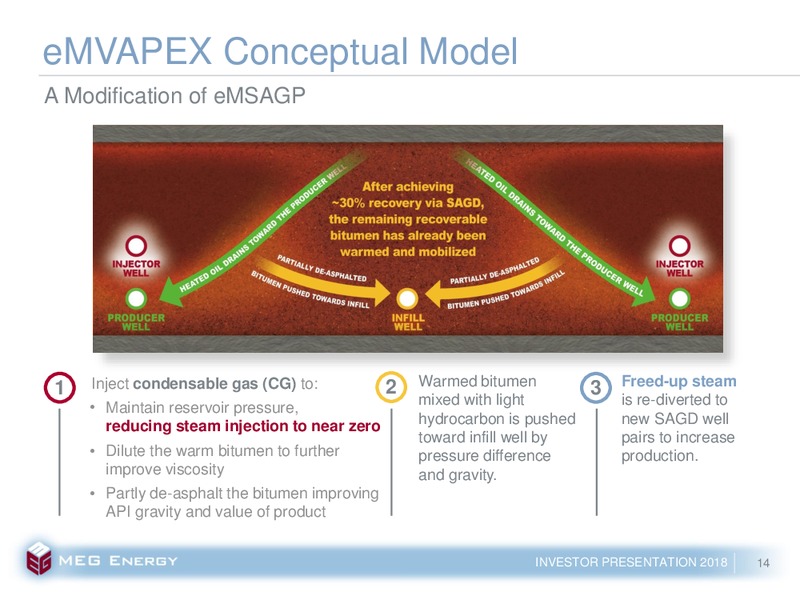
eMVAPEX Conceptual Model A Modification of eMSAGP Inject condensable gas (CG) to: 2 Warmed bitumen Freed-up steam 1 3 Maintain reservoir pressure, mixed with light is re-diverted to hydrocarbon is pushed new SAGD well reducing…
Potential eMVAPEX Benefits Further reduction of SOR over eMSAGP Lower capital Lower Lower carbon requirements operating emission to grow costs intensity Lower steam requirement Reduced energy costs Significantly lower per barrel…
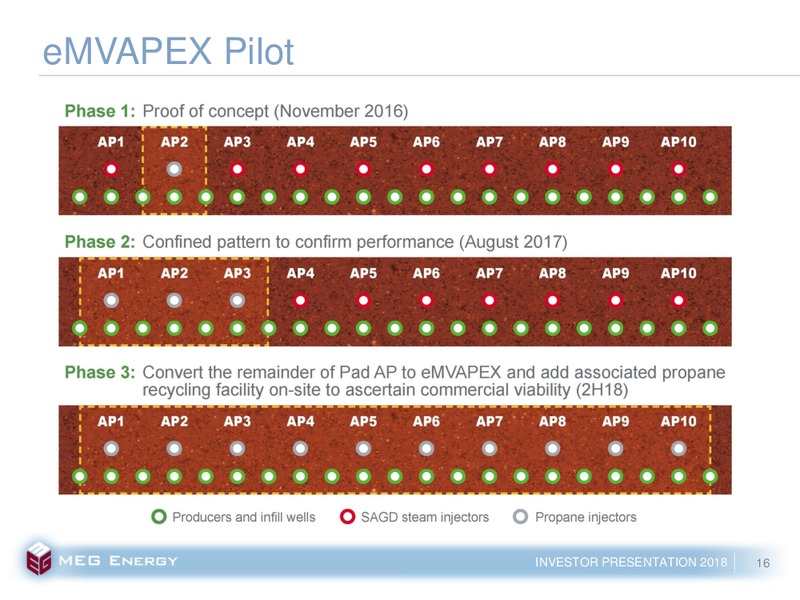
eMVAPEX Pilot INVESTOR PRESENTATION 2018 16
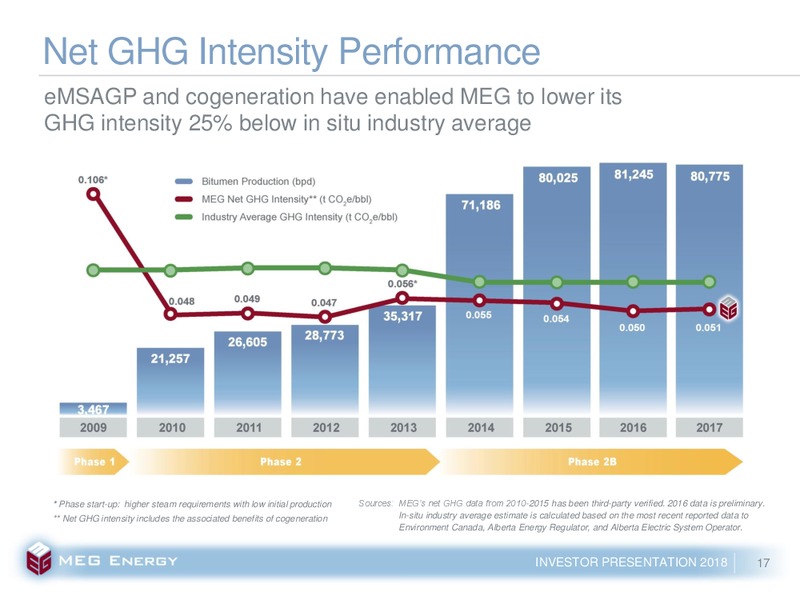
Net GHG Intensity Performance eMSAGP and cogeneration have enabled MEG to lower its GHG intensity 25% below in situ industry average * Phase start-up: higher steam requirements with low initial production Sources: MEGs net GHG data…
Continued Efficiency Gains Drive Lower Costs Highly-economic growth expected to further reduce cash costs by C1 per barrel with every 10kbpd of new production coming on stream * Per barrel costs and netbacks are calculated based on…
Active Hedging Program MEGs objective is to set a floor price, at or above cash costs, while leaving room to take advantage of improving oil prices Crude oil hedges in place as of February 8, 2018 in US * Percentage of hedged…
Substantial Reserves and Resources Regulatory approval in place or in process for nearly 500,000 bpd of potential resource development * 2018 production guidance Proved Probable 1,468 1,517 Proved and Probable Evaluated by GLJ…
Notes INVESTOR PRESENTATION 2018 21
Investor Relations Helen Kelly Director, Investor Relations 403.767.6206 helen.kellymegenergy.com John Rogers VP, Investor Relations and External Communications 403.770.5335 john.rogersmegenergy.com www.megenergy.com/investors
 Loading...