Financial results Half year ended 31 December 2017 Port Hedland
Financial results Half year ended 31 December 2017 Andrew Mackenzie Chief Executive Officer Daunia
Key messages Continued delivery of consistent plans is driving improvement across our business Maximise cash flow Capital discipline Value and returns US4.9 bn free cash flow US15.4 bn net debt ROCE up to 12.8% US12 bn in FY18 at…
Interim FY18 scorecard Financial performance supports shareholders returns Tragically we had two fatalities during the period Safety TRIF of 4.11 Financial Attributable profit of US2.0 billion; Underlying attributable profit of…
Safety and sustainability Health and safety are core to our values Safety Health Samarco We had two fatalities during the period Committed to a 50% reduction in Committed to social and environmental workers potentially exposed to…
Financial results Half year ended 31 December 2017 Peter Beaven Chief Financial Officer Escondida Escondida
Financial performance Results reflect higher commodity prices and a solid operating performance Summary H1 FY18 Income Statement Strong margins through the cycle (US billion) (Underlying EBITDA margin4, %) 60 Underlying EBITDA 11.2…
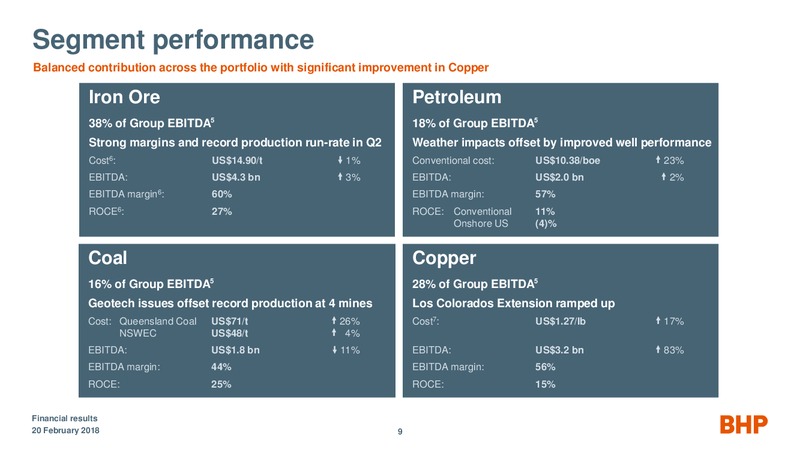
Segment performance Balanced contribution across the portfolio with significant improvement in Copper Iron Ore Petroleum 38% of Group EBITDA5 18% of Group EBITDA5 Strong margins and record production run-rate in Q2 Weather impacts…
Productivity Negative productivity of US496 million largely due to Olympic Dam planned shutdown and geotechnical issues at BMA H1 FY18 productivity performance Cumulative productivity gains (US million) (US billion) Olympic Dam BMA…
Capital allocation Relentless focus on capital discipline, debt reduction and shareholder returns H1 FY18 Operating Capital productivity productivity Net operating cash flow Less: dividends to NCIs US7.3 bn of US0.9bn14…
Balance sheet Net debt US15.4 billion; gearing 19.9%; average debt maturity of 9.4 years16 Net debt and gearing Movements in net debt (Net debt, US billion) (Gearing, %) (US billion) 30 40 20 16.3 0.7 15.4 0.9 0.1 15 25 15…
Investing for the future Ongoing improvements in capital productivity are enabling us to thrive on lower levels of capex Capital and exploration expenditure H1 FY18 H2 FY18 (US billion) US billion US billion Maintenance 1.0 1.0…
Striking a balance between cash returns and investment Our capital allocation framework is embedded in every capital decision we make Dividend determined and capital and exploration expenditure18 (US billion) 4 0 (4) Capital…
Return on Capital Employed H1 FY18 ROCE improves to 12.8% (after tax) ROCE by asset (%) Antamina19 35 Pampa Norte Productivity, technology, latent NSWEC capacity to drive further improvement 25 Cerrejn19 Improving prices and…
Onshore US Exit process tracking to plan with bids to be assessed during the September 2018 quarter Safety/ Redoubling safety efforts following fatality in the Permian Operations Well trials increasing recoveries; FY18 production at…
Financial results Half year ended 31 December 2017 Andrew Mackenzie Chief Executive Officer Neptune Angostura Angostura, Trinidad
Market outlook Near-term uncertainty, attractive long-term fundamentals Short term Medium term Long term Growth in Uncertainty Solid Steeper New demand New supply population, moderate growth cost curves centres wealth…
Our strategy Value and returns are at the centre of everything we do Simple portfolio Distinctive enablers Shareholder Diversified exposure to preferred value and Charter Values and commodities returns culture of connectivity…
Our strategy in action We drive value and returns through our six focus areas Latent Major Productivity capacity projects Exploration Technology Onshore US Financial results 20 February 2018 23
Minerals Australia Detailed plans to improve ROCE to 30% by FY22 (at FY17 prices) WAIO annualised run rate (Iron ore production, Mtpa) Targeting 10% reduction in unit costs21 over medium term FY19 exit rate 300 Productivity Minerals…
Minerals Americas Releasing latent capacity, investing in new capacity and exploring Escondida grade decline to be offset by higher throughput Record Escondida throughput with 3 concentrators (Production, Mt) (Mill head grade, %)…
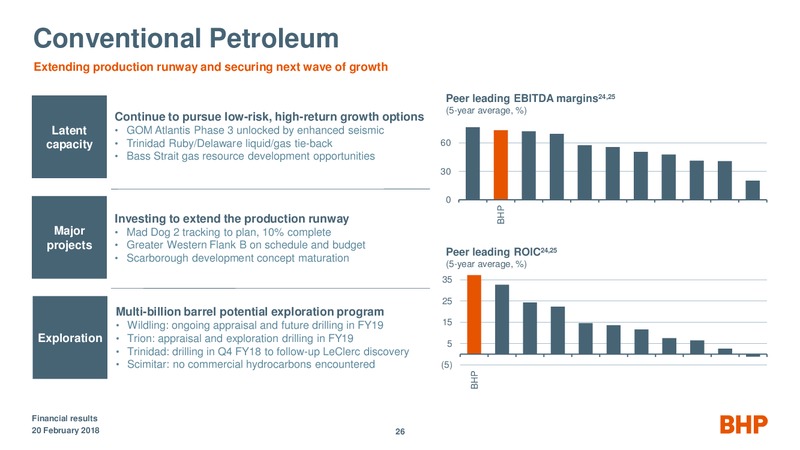
Conventional Petroleum Extending production runway and securing next wave of growth Peer leading EBITDA margins24,25 (5-year average, %) Continue to pursue low-risk, high-return growth options Latent GOM Atlantis Phase 3 unlocked by…
We are delivering against our plans in FY18 Maximise 6% copper equivalent volume growth expected in FY18 ROCE cash flow FY18 free cash flow US12 billion at spot prices13 (%) 20 Capital Expect net debt to be in US10-15 billion…
and will continue to deliver over the medium term Maximise US2 billion productivity target for FY18 and FY19 unchanged ROCE cash flow Minerals Australia targeting medium-term unit cost21 reductions 10% (%) 20 Capital Net debt…
Appendix
Samarco and Renova Foundation Committed to social and environmental rehabilitation Rio Gualaxo do Norte Rio Doce - Governador Valadares December 2016 September 2017 November 2015 August 2017 Rehabilitation (Renova Foundation)…
BHP guidance Group FY18e Capital and exploration expenditure (USbn) 6.9 Cash basis. US100 million lower Onshore US investment offsets unfavourable exchange rate movements. Including: Maintenance 2.0 Includes non-discretionary capital…
BHP guidance (continued) Copper FY18e Total copper production (Mt) 1.66 1.79 Escondida at 1.13 - 1.23 Mt; Pampa Norte production is expected to increase; Olympic Dam at 150 kt; and Antamina production at 125 kt and zinc at 100 kt.…
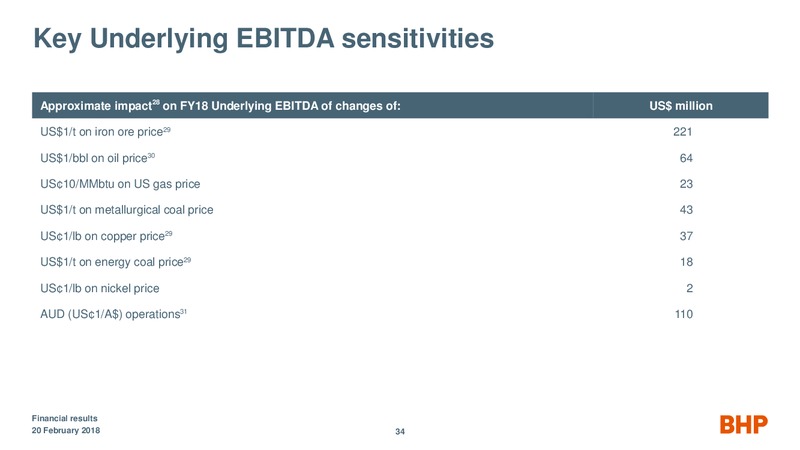
Key Underlying EBITDA sensitivities Approximate impact28 on FY18 Underlying EBITDA of changes of: US million US1/t on iron ore price29 221 US1/bbl on oil price30 64 US10/MMbtu on US gas price 23 US1/t on metallurgical coal price…
Debt maturity profile Debt balances 32,33 (US billion) 8 6 4 2 0 FY18 FY19 FY20 FY21 FY22 FY23 FY24 FY25 FY26 FY27 FY28 Post FY28 US Euro Sterling A C Bonds34 Bonds34 Bonds 34 Bonds Bonds Subsidiaries % of portfolio 38%…
 Loading...