Agenda I. Strategic Initiatives Update II. San Antonio Transaction Recap III. Appendix www.emergelp.com PAGE 3
Competitive Strengths High Quality, Technology Strategically Driven New Located Assets Products Diversified Intrinsic Product Logistics Offering Advantages Trusted Reputation w/ Low Cost Customers and Operating…
Accomplishing Our Strategic Initiatives Expanded 1 Reduced Costs 3 Sold Fuel Business 5 7 2018 Next Steps Footprint Implemented lower Received an attractive San Antonio site offers Complete San Antonio cost mining methods…
Expanding Footprint with Local InBasin Sands Local inbasin & regional sands have proved effective for certain completion designs and are now approximately 3035% of the frac sand market San Antonio Delivered cost of sand to the Eagle…
Introducing TechnologyDriven Proppants We are excited about our two technology-driven proppant products: our self-suspending SandMaxXTM sand and our dustless SandGuardTM sand. These products have unique properties compared to regular…
Building a Comprehensive Logistics Platform Our sand facilities have direct access to four Class One rail lines and can reach all major shale plays in North America on single-line hauls. Logistics Highlights Wide Geographic Presence…
Deleveraging Our Balance Sheet The refinancing transactions announced on January 5th, 2018 have dramatically improved our balance sheet and liquidity position. Refinancing Sources and Uses ( in mm) Change in Debt Balance and…
Financial Performance Estimates We experienced a strong recovery in volume and Adjusted EBITDA during 2017. For 2018, we are projecting further improvements in volume and Adjusted EBITDA based on the strong market demand and the…
Capitalizing on a Strong End Market: Robust Demand for Frac Sand Frac sand demand in 2017 surpassed historical peak levels, and further growth is expected for 2018 and 2019. Average proppant intensity per horizontal well continues to…
Agenda I. Strategic Initiatives Update II. San Antonio Transaction Recap III. Appendix www.emergelp.com PAGE 12
Introduction to the San Antonio Plant Located 25 miles south of San Antonio, TX 650 total owned acres (surface and sand mineral Property Details rights) Estimated over 80 million(1) tons of sand resources Current wet plant:…
San Antonio Plant: Best in Class Business Model High quality reserves Large property and deposit In-basin location Dual rail service Minimal overburden All production operations located on site (avoids trucking) Owned reserves…
Growing Demand for Frac Sand in Eagle Ford Basin While the Permian basin receives most of the attention, activity in the Eagle Ford basin, the second most active shale play, is gaining momentum with several notable operators in the…
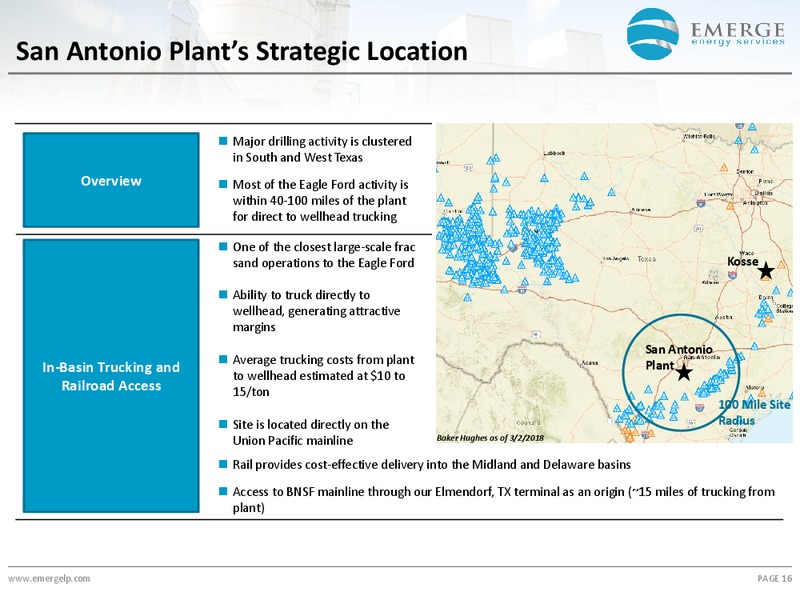
San Antonio Plants Strategic Location Major drilling activity is clustered in South and West Texas Overview Most of the Eagle Ford activity is within 40100 miles of the plant for direct to wellhead trucking One of the closest…
Industrial Sands End Market Central Texas (San Antonio and Austin metro areas) is one of the fastest growing regions in the country Approximately 4.5 million residents estimated as of 2016 Our San Antonio plant currently…
San Antonio Plant Expansion Plan New Plant, New Plant, Current Existing Permit New Permit 4,000 Frac Sand Production 2,400 Cumulative Capacity (000 tons per year) 300 Timing Completed Received permit July 17…
Attractive Valuation for InBasin Sand Acquisition ( in mm's, except per EMES San ton metrics) Competitor A Competitor B Competitor C Antonio Site (1) (2) Announced Purchase Price 20 145 275 214 (3) (1) (4) Est. Capex for Plant…
Expanded Footprint and Balanced Mix The San Antonio site provides a more balanced footprint with a diversified mix of northern white and inbasin sands. Before San Antonio After San Antonio Reserves(1) Inbasin 26% Inbasin…
Agenda I. Strategic Initiatives Update II. San Antonio Transaction Recap III. Appendix www.emergelp.com PAGE 21
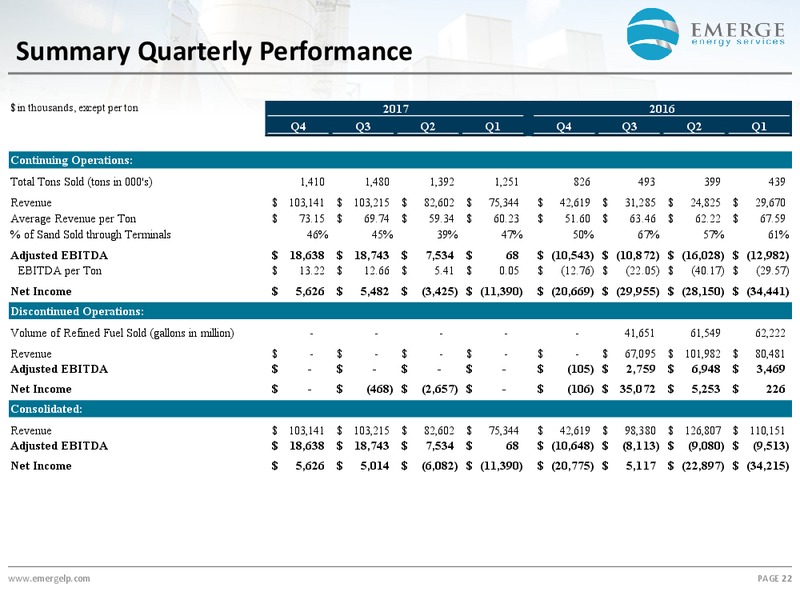
Summary Quarterly Performance in thousands, except per ton 2017 2016 Q4 Q3 Q2 Q1 Q4 Q3 Q2 Q1 Continuing Operations: Total Tons Sold (tons in 000's) 1,410 1,480 1,392 1,251 826 493 399 439 Revenue 103,141 103,215 82,602 75,344 42,619…
Management and Board of Directors Years of Name Title Professional Experience Senior Management Team Rick Shearer Chief Executive Officer of EMES; CEO of SSS 43 Warren B. Bonham Vice President of EMES 32 Deborah Deibert Chief…
From Mine to Railcar 1) Extract 2) Wash 3) Dry 4) Ship www.emergelp.com PAGE 25
Asset Summary Wet Plant Location Proven Recoverable Plant Capacity 2017 Wet Production Reserves (1) (Thousands of Tons) (Thousands of Tons) New Auburn, WI 16.4 mm tons 2,000 1,276 Thompson Hills, WI 38.2 mm tons 1,600 1,394 FLS…
North American Sand Markets We have single-line access to four Class One railroads, which provide direct rail access to every major basin in North America Railroad Network BNSF CN/GTW CP/SOO CSX /NS KCS/KSCSM UP FWWR /…
Consolidated Net Income to Adjusted EBITDA Reconciliation in thousands 2017 2016 Q4 Q3 Q2 Q1 Q4 Q3 Q2 Q1 Net income 5,626 5,014 (6,082) (11,390) (20,775) 5,117 (22,897) (34,215) Depreciation, depletion and amortization 5,490 6,078…
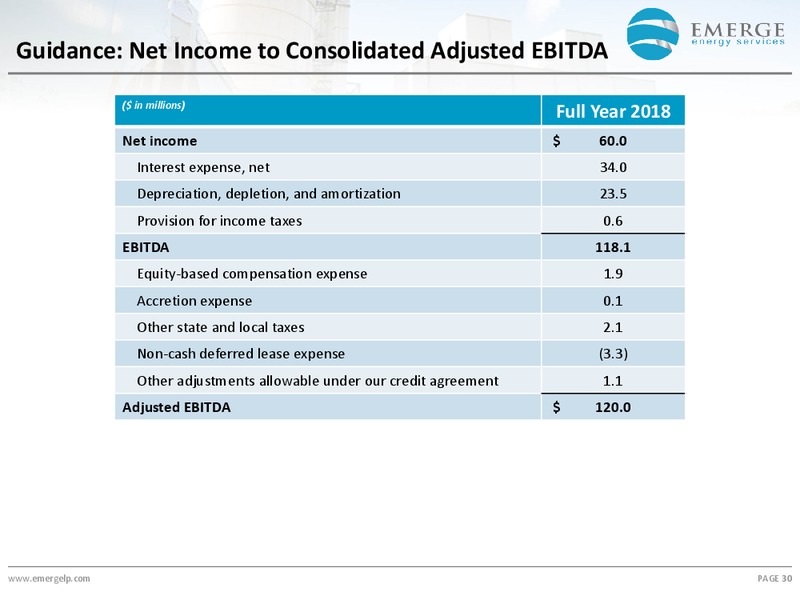
Guidance: Net Income to Consolidated Adjusted EBITDA ( in millions) Full Year 2018 Net income 60.0 Interest expense, net 34.0 Depreciation, depletion, and amortization 23.5 Provision for income taxes 0.6 EBITDA 118.1 Equitybased…
 Loading...