Faroe Petroleum 2017 Final Results Presentation 20 March 2018 1 Slide 1
2017 results summary + 2018 outlook Material investment phase for Faroe 2017 production towards top end of guidance Total average economic production1 for 2017 at 14,349 boepd (2016: 17,395 boepd) following Njord/Hyme shut-in…
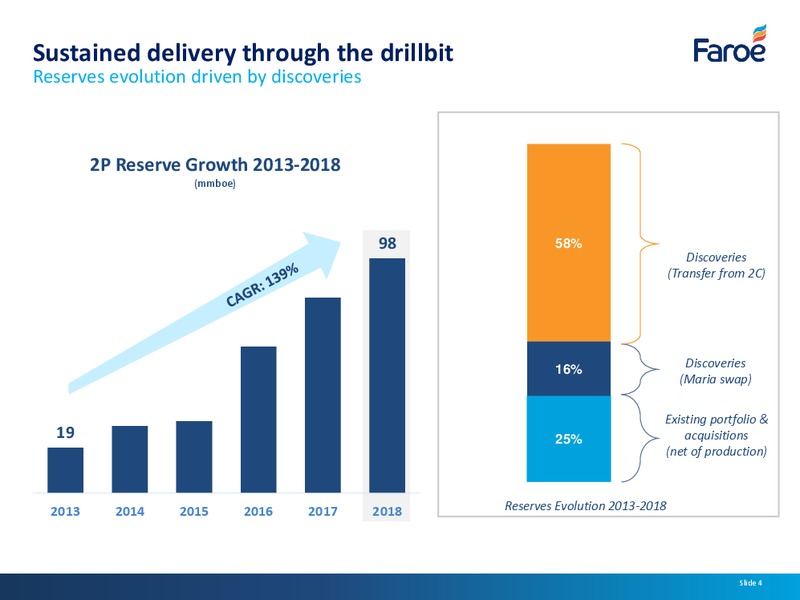
Sustained delivery through the drillbit Reserves evolution driven by discoveries 2P Reserve Growth 2013-2018 (mmboe) 98 58% Discoveries (Transfer from 2C) 81 61 16% Discoveries (Maria swap) Existing portfolio & 19…
Visible, material organic production growth Organic projects fully funded with additional infill and field investment upside 50,000 Contingent Resources incl. infills Production Gross (boepd) Margin /boe…
Key catalysts 2018 Value-driving events over next 12 months 2018 2019 Q1 Q2 Q3 Q4 H1 Tambar infills Development Production & Brage infills Brasse DG2 and PDO Fenja PDO approval1 Oda first oil Iris/Hades Exploration &…
Asset summary
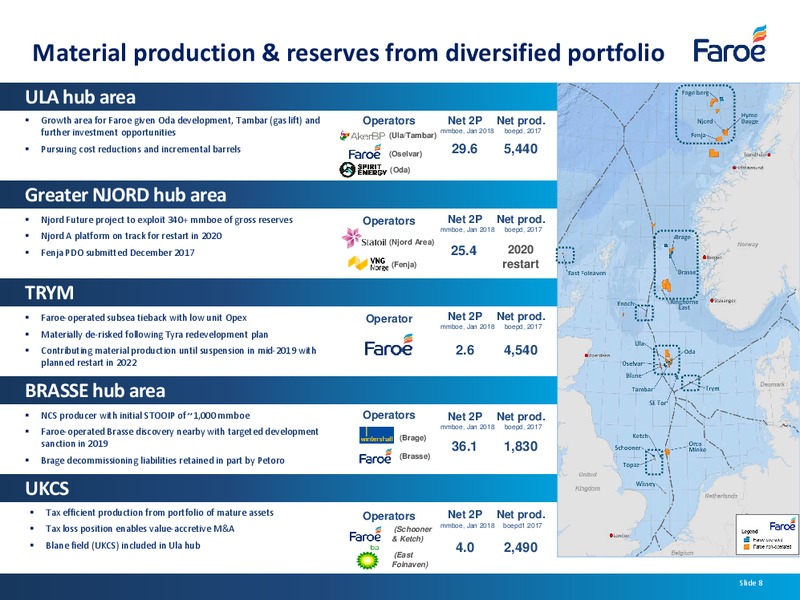
Material production & reserves from diversified portfolio ULA hub area Growth area for Faroe given Oda development, Tambar (gas lift) and Operators Net 2P Net prod. further investment opportunities (Ula/Tambar) mmboe, Jan 2018 boepd,…
BRASSE hub area: Flagship operated project Robust, simple subsea development project with excellent address Brasse: (Faroe 50% and operator) PL740 Brasse oil and gas discovery July 2016 similar to Brage Matured to 2P reserves within 18…
ULA hub area: Ula, Tambar, Blane, Oda and Oselvar Significant upside from further infill drilling and WAG scheme Ula, Tambar, Oda and Blane Ula (Faroe 20%) Renewed exploitation drive underway led by AkerBP New 4D seismic, infill…
NJORD hub area: Njord+ Hyme + Bauge + Fenja Attractive projects with excellent upside Njord: (Faroe 7.5%) + Fenja (Faroe 7.5%*) Significant resource base Gross reserves on Faroe licences estimated to be more than 340 mmboe (gross)…
Exploration benefiting from significantly lower costs Tax-efficient exploration offers material value uplift Balanced exploration strategy with strict internal criteria Benefiting from lower exploration costs Brasse among cheapest…
Financial
2017 final results & 2018 outlook Financial highlights and outlook 2017 Results Revenue 152.9m (2016: 94.8m), EBITDAX 82.2m (2016: 25.8m) Production 2017 economic production 14,349 boepd, forecast 2018 production 12-15,000 boepd…
2017 Results Summary Increased EBITDAX and fully financed Financial Summary (m) 2017 2016 Explanation An increase of 76% in accounting production (due to acquisition of DONG assets) and recovery Revenue (IFRS) 152.9 94.8 in commodity…
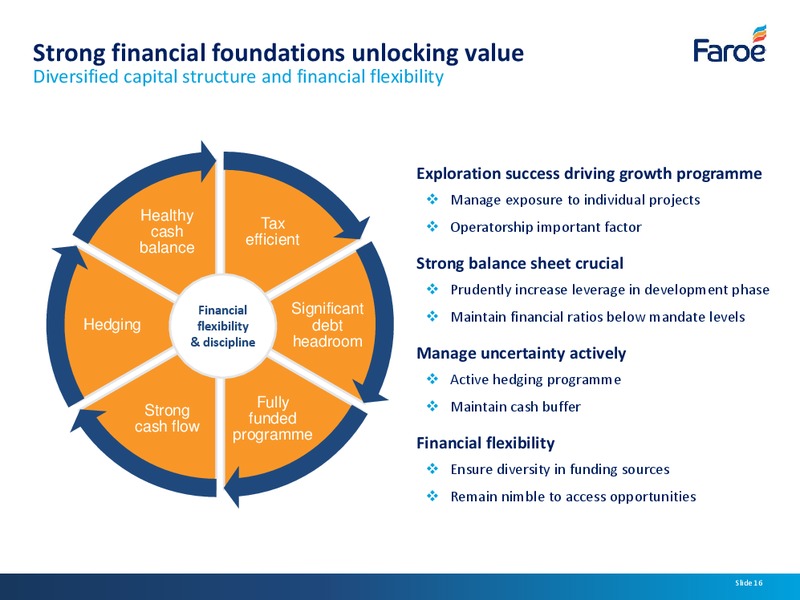
Strong financial foundations unlocking value Diversified capital structure and financial flexibility Exploration success driving growth programme Manage exposure to individual projects Healthy cash Tax Operatorship important…
2018 outlook Material investment phase for Faroe Production outlook Forecast 12-15,000 boepd (2018), maintaining production levels during material investment phase Highest ever investment in development Njord & Bauge, Oda, Fenja,…
Appendices
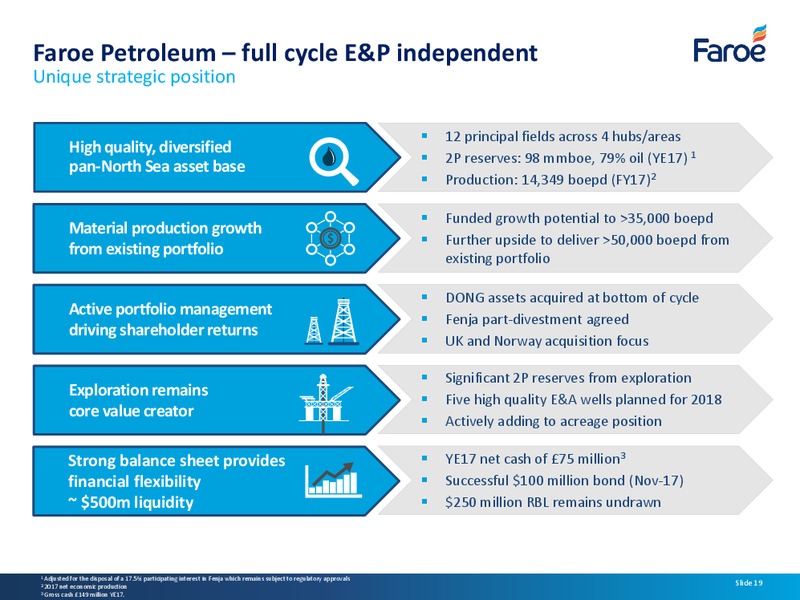
Faroe Petroleum full cycle E&P independent Unique strategic position 12 principal fields across 4 hubs/areas High quality, diversified 2P reserves: 98 mmboe, 79% oil (YE17) 1 pan-North Sea asset base Production: 14,349 boepd…
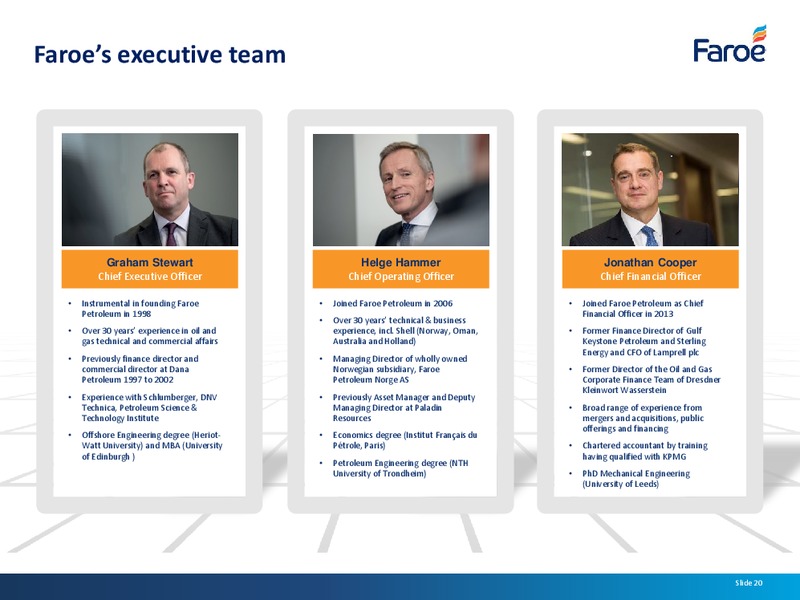
Faroes executive team Graham Stewart Helge Hammer Jonathan Cooper Chief Executive Officer Chief Operating Officer Chief Financial Officer Instrumental in founding Faroe Joined Faroe Petroleum in 2006 Joined Faroe Petroleum as…
Strong support from institutional shareholders Share price performance and shareholder overview 12 Month share price performance Major shareholder split* 135 Aviva: 6.6% Other institutional Blackrock: 9.0% 47.4% 125 JP Morgan:…
Group Income Statement 2017 2016 000 000 Revenue 152,924 94,779 Cost of sales (132,508) (96,666) Asset Impairment (12,992) (2,923) Gross profit / (loss) 7,424 (4,810) Other income / (expense) 17,353 (8,412) Gain on…
Group Balance Sheet 2017 2016 Non-current assets 000 000 Goodwill 9,386 7,744 Intangible assets 68,857 107,376 Property, plant and equipment: development & production 201,216 157,328 Other assets 695 611 Deferred tax assets…
Group Cash Flow Statement Condensed Group Cash Flow Statement 2017 2016 for the year ended 31 December 000 000 Loss before tax (13,739) (61,595) Depreciation, depletion and amortisation 45,179 23,369 Exploration asset write off…
 Loading...