Centennial 2018 Game Plan Grow net oil production 85% to 35,500 Bo/d Grow net oil production from 19,200 Bo/d in 2017 to 65,000 Bo/d in 2020 Maintain mid-cap industry leadership position regarding oil shale G&G and well completion…
Q1 2018 Financial and Operational Highlights Increased first quarter daily oil production 15% versus Q4 2017 to 31,573 Bo/d Grew oil and equivalent production volumes 201% and 193% year-over-year, respectively Announced strong…
Continuing to Deliver Strong Quarterly Results Production (Bo/d and Boe/d) Adjusted EBITDAX1 ( mm) Cash operating costs ( / Boe) 54,069 Net income2 Cash G&A3 Oil equivalent production (Boe/d) 161.6 Production / Ad Valorem Taxes Oil…
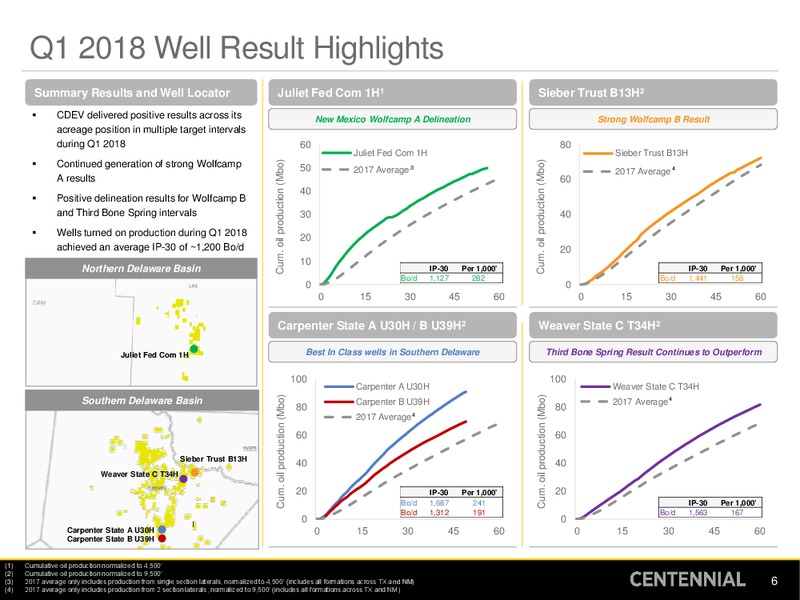
Q1 2018 Well Result Highlights Summary Results and Well Locator Juliet Fed Com 1H1 Sieber Trust B13H2 CDEV delivered positive results across its New Mexico Wolfcamp A Delineation Strong Wolfcamp B Result acreage position in multiple…
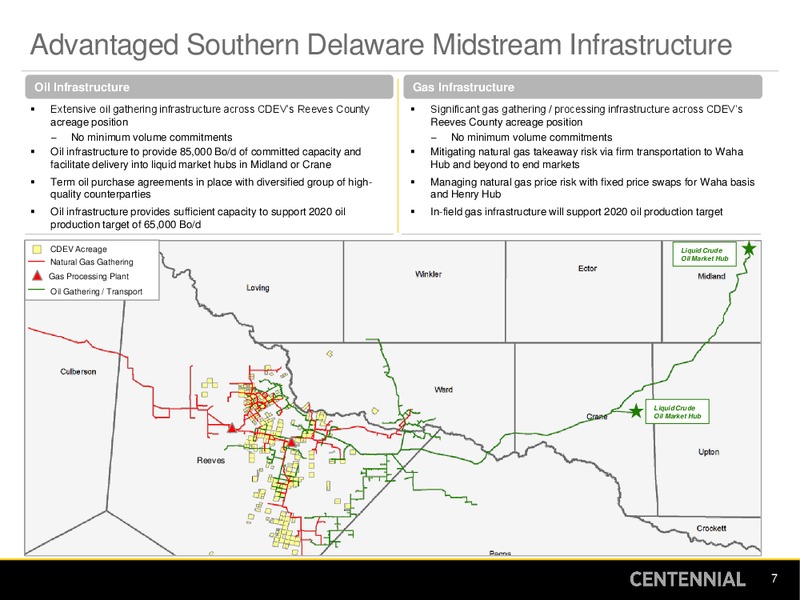
Advantaged Southern Delaware Midstream Infrastructure Oil Infrastructure Gas Infrastructure Extensive oil gathering infrastructure across CDEVs Reeves County Significant gas gathering / processing infrastructure across CDEVs acreage…
Unhedged Oil: Driving Realization Benefits Centennial remains 100% unhedged on crude oil pricing, offering full exposure to the recent price uplift and future upside Centennial has 10,000 Bbl/d of Midland-Cushing Basis differential…
Q1 2018 Financial Results Financial summary (mm, unless otherwise noted)1 ( in millions, unless specified) Q1 2017 Q4 2017 Q1 2018 Average Daily Production (Boe/d) 18,469 44,304 54,069 Average Daily Oil Production (Bo/d) 10,489…
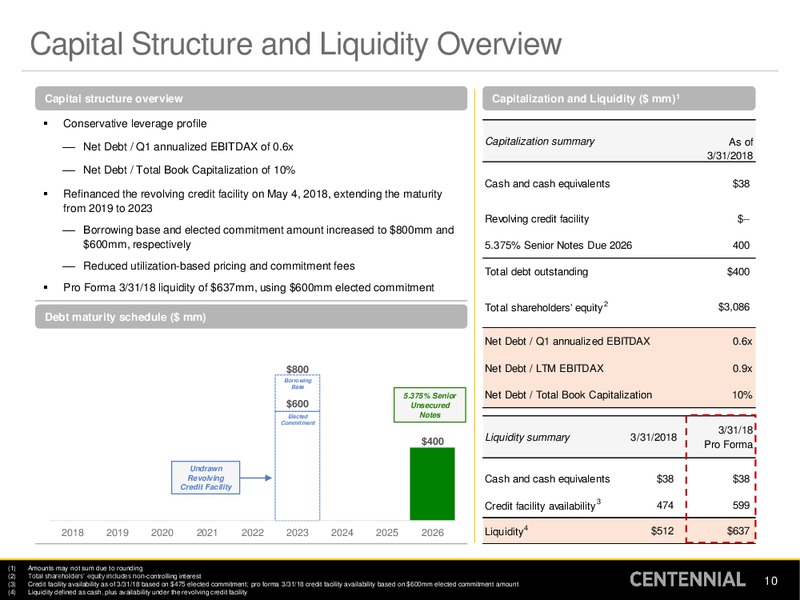
Capital Structure and Liquidity Overview Capital structure overview Capitalization and Liquidity ( mm)1 Conservative leverage profile Capitalization summary As of Net Debt / Q1 annualized EBITDAX of 0.6x 3/31/2018 Net Debt / Total…
 Loading...