May 2018 Eclipse Resources: At a Glance Corporate Profile Pure play Appalachian company Strategic acreage position with over 150,000 net acres1 347 extended reach locations with 16 years of inventory2 Proved reserves of 1.45 Tcfe…
May 2018 Managements Focus on Full Cycle Returns Eclipse management interests are aligned with shareholders with compensation tied to achieving full-cycle corporate returns in excess of the Companys WACC Corporate Compensation…
May 2018 Eclipse Recent Accomplishments Achievements & Goals (2016-2018e) 2017 Operational Achievements 2016 2017 2018e Grew production 36% year over year to 311 MMcfe/d: 77% natural gas, 14% NGLs, 9% oil 311 330 Established…
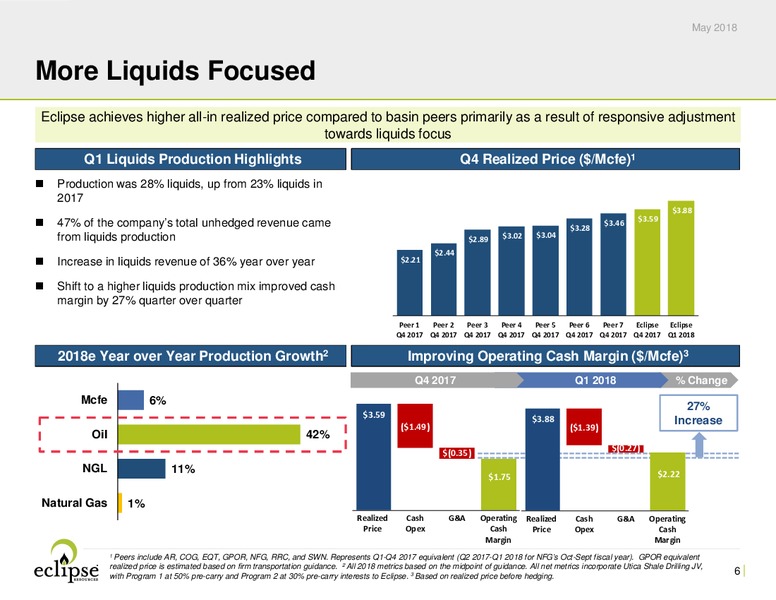
May 2018 More Liquids Focused Eclipse achieves higher all-in realized price compared to basin peers primarily as a result of responsive adjustment towards liquids focus Q1 Liquids Production Highlights Q4 Realized Price (/Mcfe)1…
May 2018 Ohio Oil Production1 Based on recent Ohio statewide data, Eclipse has drilled eight of the top ten oil producing Utica Shale wells Q4 2017 : Eclipse Top Oil Producing Wells in Ohio 2,500 80% 66% 65% 66% 67% 65% 62%…
May 2018 Marcellus Area Validated Production to date on first two pilot wells is exceeding updated Type Curve estimates Initial Marcellus Evaluation1 Marcellus Initial Development Two Marcellus wells in Ohio turned to sales on…
May 2018 2017 Reserves and 3-Year Average F&D Costs Eclipse continues to lower its 3-year average F&D costs and increase reserves through the drill-bit, generating substantial year over year increases in proved reserves PV-10…
May 2018 Leader in Revenue per Lateral Foot Eclipses well productivity leads its Utica Shale peers on a gross revenue per foot and per well basis First Three Months Gross Revenue Per Lateral Foot and Gross Revenue Per Well 600…
May 2018 Utica Shale Drilling Joint Venture Transaction Summary1 Utica Shale Drilling Joint Venture with Sequel Energy increases Eclipses return on capital at an attractive implied per acre valuation and improves well economics…
May 2018 What we are up to in 2018 Eclipse is lowering its 2018 capital expenditures by 20% to 250 million1 Operational Highlights Net Revenue Before Hedging2 600 Eclipse is lowering its 2018 capex by 20% to 250 million, which…
May 2018 Development Optimization Iterative process of analysis, modeling, and execution leads to individual well designs tailored to optimize return Manage production to maximize Re-examine drilling, completions return and EUR:…
May 2018 Super Lateral Rationale Eclipses Super Lateral development decreases costs and increases rates of return as compared to an equal amount of lateral footage developed by two shorter wells Utica Condensate Case Study Two…
May 2018 Incremental Economic Impact of Super Laterals Extending well length from 13,000 to 20,000 creates 975 1,520 PV10 per foot with an incremental IRR of 130% 215% Well Level Capital Cost per Lateral Length Condensate Area EUR…
May 2018 Eclipse Advantage in Flat Castle Eclipses Super Lateral technologies generate outsized returns in a depressed natural gas market Untapped Potential in Flat Castle Super Lateral Length Progression 42,900 highly contiguous…
May 2018 Flat Castle Gas In Place and Recovery Factors Large gas in place volumes in Flat Castle Project Area support the potential for reserve growth per well and further IRR gains Gas in Place Characteristics Strong Regional Gas…
May 2018 Delineation of Flat Castle Project Area by Key Industry Wells Eclipse is consolidating its acreage position in the highest gas in place area to support extending lateral lengths to up to 20,000 Travis Peak Painter 1H EUR /…
May 2018 Eclipse Flat Castle Project Area Type Curves Eclipse has developed two type curves for the Flat Castle Project Area (i) a base case and (ii) an upside case that is increased by 12% to reflect higher gas in place on Eclipse…
May 2018 Attractive Flat Castle Project Area Type Curves1 Well costs and returns assume higher completion costs of a modern completion without an assumed increase in EUR as compared to offset wells Base Case Upside Case IRR…
May 2018 Marketing Strategy Eclipses diversified marketing strategy provides flexibility and favorable market access for both its Ohio and Flat Castle development areas Flow Assurance Diversification Optionality Risk Management…
May 2018 Demand Drivers Northeast Takeaway Appalachian basis differentials narrow as projects come online and transportation capacity exceeds production and projects come online Northeast Production vs Pipeline Takeaway1 45.0 Base…
May 2018 Eclipse Firm Transportation Update Diverse firm gas transportation portfolio provides optionality to various markets, with right-sized positions to maximize revenue 1,200,000 As Rover enters service, gross marketed…
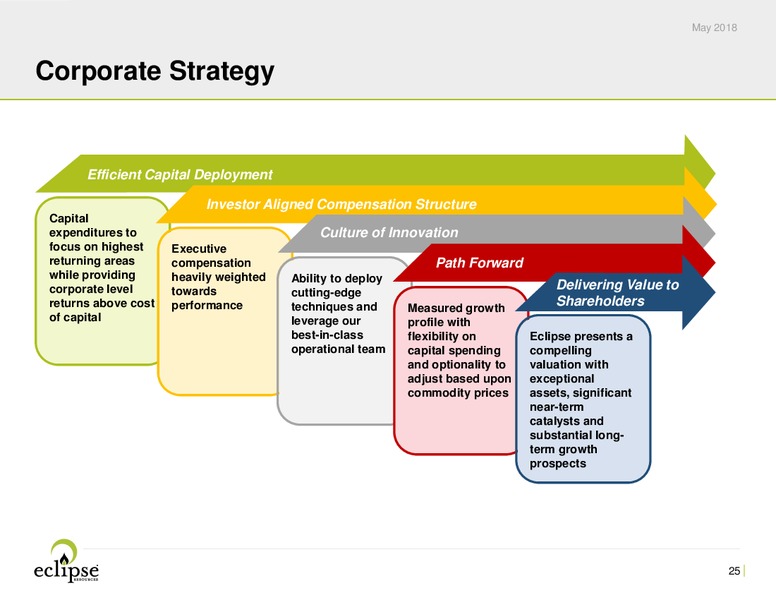
May 2018 Corporate Strategy Efficient Capital Deployment Investor Aligned Compensation Structure Capital expenditures to Culture of Innovation focus on highest Executive returning areas compensation Path Forward while…
A PPENDIX
May 2018 Q2 and 2018 Guidance Q2 2018E FY 2018E Low High Low High Avg. Daily Production (MMcfe/d) 290 300 325 335 % Natural Gas 73% 75% 72% 75% % NGL 14% 16% 13% 17% % Oil 10% 12% 10% 13% Forecasted Realizations Natural Gas…
May 2018 2018 Utica Dry Gas Type Curve Accelerates Returns Detailed engineering analysis supports moving to a more accelerated dry gas production profile, increasing type curve returns while maintaining EUR New Production Profile…
May 2018 Premier Utica and Marcellus Assets Eclipse has 347 risked future extended reach lateral locations, equating to 16 years of drilling inventory based on 3-year development plan outlook Condensate Rich Gas Dry Gas…
May 2018 2018 Ohio Type Curves and Flat Castle Type Curves Marcellus Flat Castle Base Flat Castle Upside Type curves do not represent proved reserves Utica Condensate Utica Rich Gas Utica Dry Gas Condensate Case Case Type Curve…
May 2018 2018 Type Curve Summary Utica Condensate Utica Rich Gas Utica Dry Gas Marcellus Condensate Flat Castle Base Case Flat Castle Upside Case Gas IP Rate (Mcf/d) 7,200 30,600 44,350 12,960 40,712 45,598 Initial Cond. Yield…
May 2018 Hedging Update Eclipse is 85% hedged for natural gas and 70% hedged for condensate production in 2018 and has been actively adding incremental hedges in 2019 to further limit cash flow uncertainty Summary of Current Hedges…
May 2018 Hedging Summary1 Volume Weighted Average Natural Gas Hedges Production Period (MMBtu/d) Price (/MMBtu) Natural Gas Swaps 30,000 Apri l 2018 - Ma rch 2019 2.90 20,000 Apri l 2018 - December 2018 2.80 20,000 Jul y 2018 -…
May 2018 Non-GAAP Reconciliations Adjusted EBITDAX Thre e Months Ende d March 31, thousands 2018 2017 Net income (loss) (3,472) 26,847 Depreciation, depletion and amortization 31,545 26,189 Exploration expense 15,735 11,581…
 Loading...