Q1 2018 Results Q1 2018 results in line with expectations Average daily throughput of 1,060 Bbtu/d in Q1 2018 12th consecutive quarterly cash distribution increase at targeted 15% annual growth rate Reaffirming financial guidance Q1…
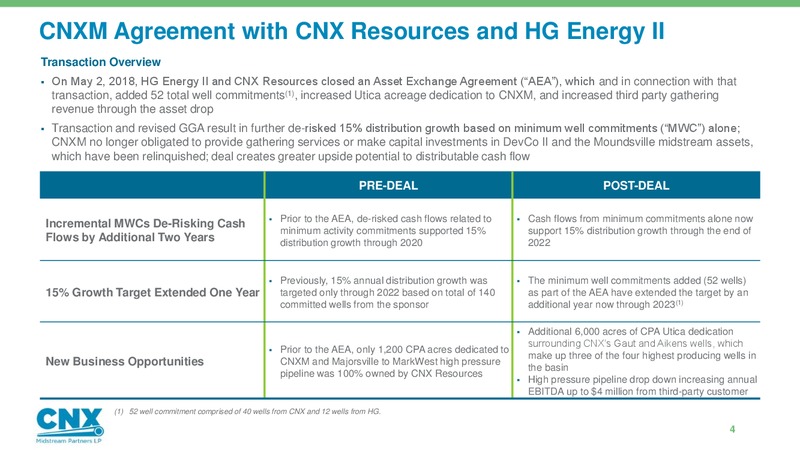
CNXM Agreement with CNX Resources and HG Energy II Transaction Overview On May 2, 2018, HG Energy II and CNX Resources closed an Asset Exchange Agreement (AEA), which and in connection with that transaction, added 52 total well…
Details of HG Energy Asset Exchange Agreement Outgoing Incoming 5% interest in DevCo II and Moundsville non-core midstream assets 16,100 Utica acres dedication in DevCo I SWPA and CPA Dedication release of 18,000 net acres Increase of…
CNXM DevCo Overview Before and After Exchange Prior to Exchange Transaction After Exchange Transaction DevCo I Throughput includes: CPA Wet and dry SWPA Central production Shirley-Pennsboro Both Marcellus and Utica shale…
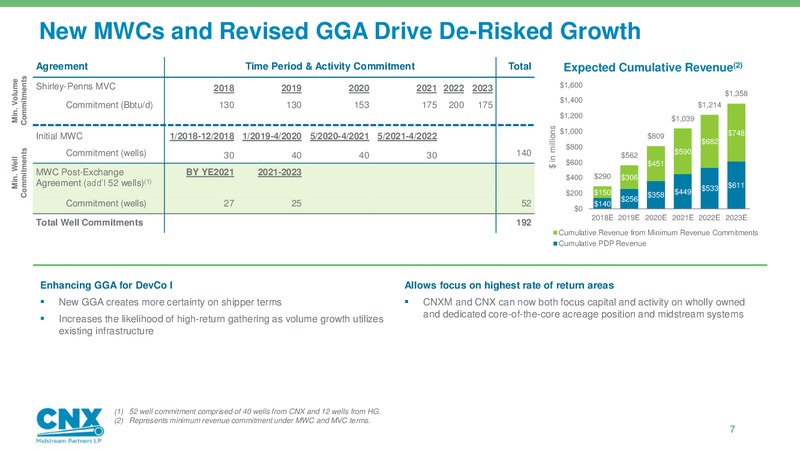
New MWCs and Revised GGA Drive De-Risked Growth Agreement Time Period & Activity Commitment Total Expected Cumulative Revenue(2) Commitments Min. Volume Shirley-Penns MVC 1,600 2018 2019 2020 2021 2022 2023 1,358 1,400…
AEA Further De-Risks and Extends 15% Distribution Growth Five-Year Baseline Distributable Cash Flow Outlook 2020E-2022E distributions now covered by 350 de-risked cash flows 300 15% distribution growth target extended from 2022…
Transaction Expands Sponsor SWPA Central Marcellus Inventory CNX SWPA Central Marcellus Inventory 2018E-2020E 500 450 Additional Locations from TILs 46 HG Exchange 400 70 TILs 55 350 TILs 73 300 Additional SWPA Central Marcellus…
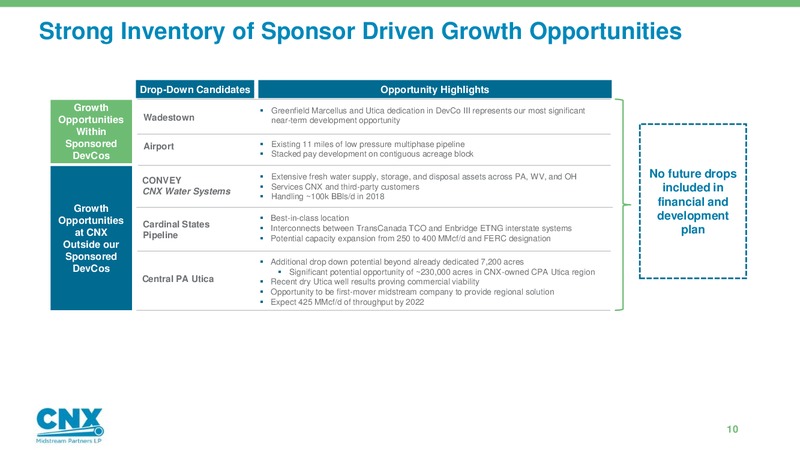
Strong Inventory of Sponsor Driven Growth Opportunities Drop-Down Candidates Opportunity Highlights Growth Greenfield Marcellus and Utica dedication in DevCo III represents our most significant Opportunities Wadestown near-term…
Non-GAAP Reconciliation EBITDA and Adjusted EBITDA We define EBITDA as net income (loss) before net interest expense, depreciation and amortization, and Adjusted EBITDA as EBITDA adjusted for non-cash items which should not be included…
Non-GAAP Reconciliation ( in thousands) Three Months Ended March 31, (unaudited) 2018 2017 Net Income 33,705 33,240 Depreciation expense 5,856 5,671 Interest expense 2,489 1,038 EBITDA 42,050 39,949 Non-cash unit-based compensation…
Non-GAAP Reconciliation ( in thousands) Twelve Months Ended (unaudited) 3/31/2018 3/31/2017 12/31/2017 Net Income 134,527 126,067 134,062 Depreciation expense 22,877 22,033 22,692 Interest expense 6,011 2,418 4,560 EBITDA 163,415…
 Loading...