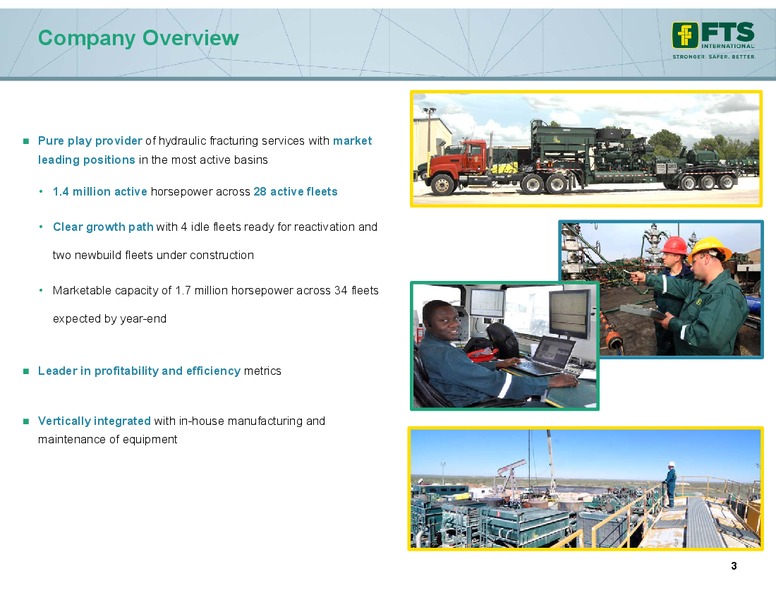
Company Overview Pure play provider of hydraulic fracturing services with market leading positions in the most active basins 1.4 million active horsepower across 28 active fleets Clear growth path with 4 idle fleets ready for…
Management Team Michael Doss Joined FTSI in January 2014, CEO since October 2015 Chief Executive Officer Previously held positions with Energy Transfer, Moodys and Ernst & Young Joined FTSI in June 2015, COO since October…
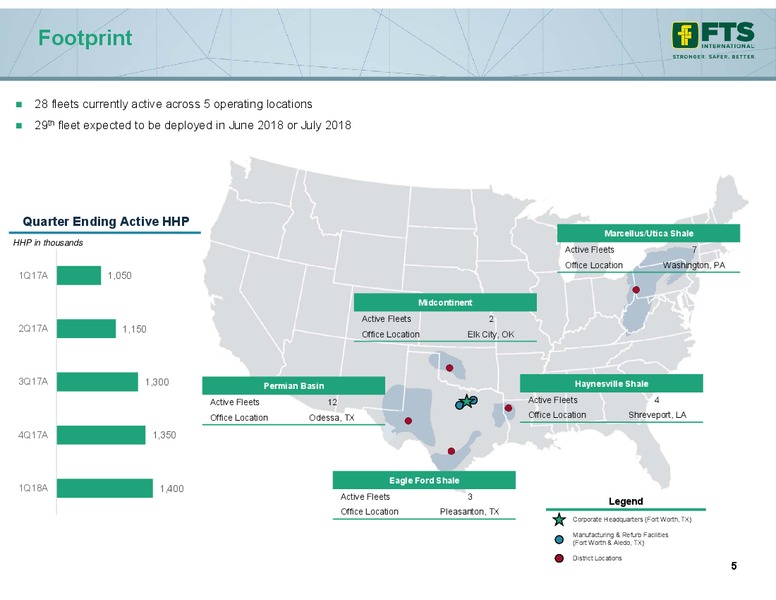
Footprint 28 fleets currently active across 5 operating locations 29th fleet expected to be deployed in June 2018 or July 2018 Quarter Ending Active HHP Marcellus/Utica Shale HHP in thousands Active Fleets 7 Office Location…
Cost-Advantaged, In-House Manufacturing At full utilization, we believe our in-house manufacturing capability generates as much as 85mm of savings per year, in addition to improving our operational efficiency Frac Units Pumps…
Utilizing Innovative Technologies to Improve Operations National Operations Center Partnered with KCF Technologies and use their Completed construction of our new National Operations Center SmartDiagnostics vibration sensors to…
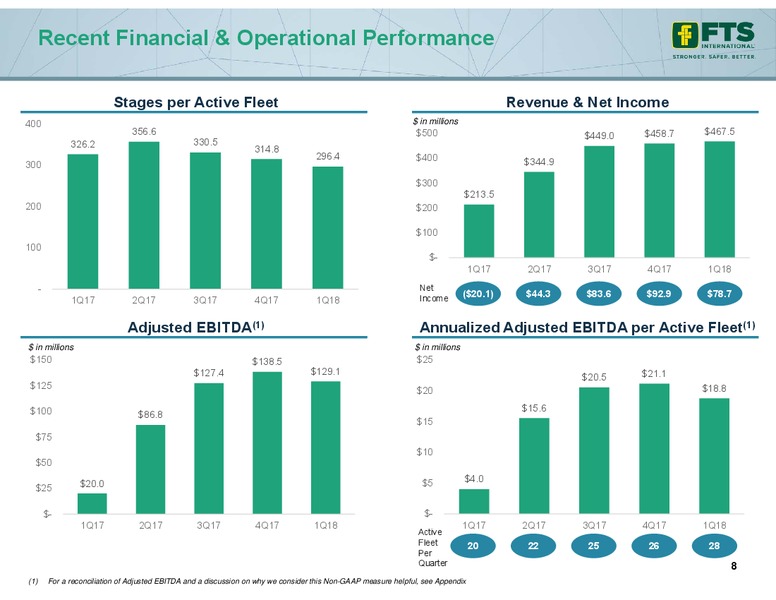
Recent Financial & Operational Performance Stages per Active Fleet Revenue & Net Income 400 in millions 356.6 500 449.0 458.7 467.5 326.2 330.5 314.8 296.4 400 300 344.9 300 213.5 200 200 100 100 - 1Q17 2Q17 3Q17 4Q17 1Q18…
Industry Leading Cash Generation 19-21 2.5 Zero Maintenance capex EBITDA Effective federal per fleet per fleet (million) (2) tax rate (3) (1) (million) Best in class cash conversion Solid execution with a focus on safety…
On Track to Achieve Gross Debt Target of 500 Million Significant Deleveraging Progress in millions 1,400 1,200 127 139 194 1,000 208 500M reduction 735 in net debt 800 200M above IPO 600 proceeds 1,081 1,069 1,014 922 400…
Appendix
Reconciliation ( in millions) Three Months Ended March 31, 2017 June 30, 2017 September 30, 2017 December 31, 2017 March 31, 2018 Net income (loss) (20.1) 44.3 83.6 92.9 78.7 Interest expense, net 21.2 21.5 22.1 21.9 17.4…
Contact Corporate Office: 777 Main Street, Suite 2900 Fort Worth, Texas 76102 817.862.2000 www.FTSI.com Investor Relations: Lance Turner (Chief Financial Officer) Michael Messina (Investor Relations) InvestorsFTSI.com…
 Loading...