Table of Contents 2Q18 Financial Recap Operational Highlights CapEx and Liquidity Completion & Remedial Services Well Services Water Logistics 2Q18 Takeaways 3Q18 Outlook Non-GAAP Reconciliation 3 3
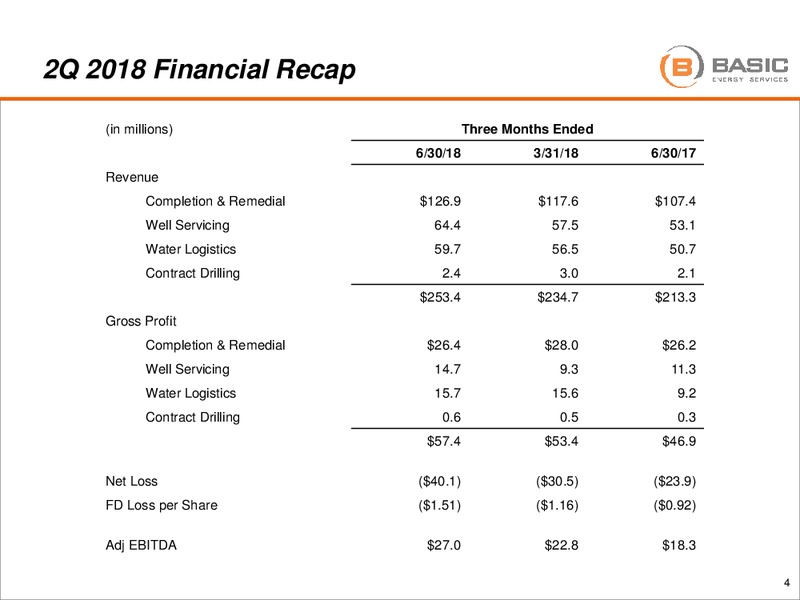
2Q 2018 Financial Recap (in millions) Three Months Ended 6/30/18 3/31/18 6/30/17 Revenue Completion & Remedial 126.9 117.6 107.4 Well Servicing 64.4 57.5 53.1 Water Logistics 59.7 56.5 50.7 Contract Drilling 2.4 3.0 2.1 253.4…
2Q 2018 Operational Highlights Steady growth in Well Servicing and Water Logistics segments: Well Servicing segment revenue up 12% sequentially to 64.4 mm, with margins up 670 bps q/q to 22.9% Water Logistics segment revenue…
Operational Update 2Q18 1Q18 4Q17 Well servicing rig hours 181,600 168,500 159,500 Well servicing utilization rate 82% 76% 53% Number of well servicing rigs - end of period 310 310 421 Fluid services truck hours 486,800 479,600…
CapEx and Liquidity Capital expenditures (including capital leases) for 2Q18 totaled 24.4 million Maintenance/sustaining expenditures were 21.5 million Expansion projects and other totaled 2.9 million 2018 capital expenditures…
Balance Sheet and Liquidity June 30, 2018 millions Cash and cash equivalents 31 Restricted Cash 47 150 million Revolver 90 Term Note Facility 162 Other debt and capital leases (net of discounts) 76 Total debt 328…
Completion and Remedial Services Segment Revenue Breakdown Operational Highlights 2Q18 1Q18 4Q17 Pressure pumping experienced a stronger May and June after choppiness in April Pumping 68% 62% 62% Pricing pressure in the Permian and…
Well Services Segment Analysis Operational Highlights 2Q18 1Q18 4Q17 Rigs working with 24-hour packages Rig Hours (000s) 181.6 168.5 159.5 increased from an average of 21 in 1Q to 24 in 2Q Utilization 82% 76% 53% Rental and fishing…
Water Logistics Segment Analysis Operational Highlights 2Q18 1Q18 4Q17 Average revenue per truck up 12% from 1Q Trucks (Avg.) 900 960 967 Approximately 23% of SWD volumes were fed by pipeline during the quarter Rev/Truck (000s)…
2Q18 Takeaways Well Servicing appears to have passed an inflection point, with improved utilization and rates driving margins higher Several opportunities to increase rates remain, with several rate increases incorporated throughout…
3Q18 Outlook Despite revenue trending higher thus far in the third quarter, the strategic realignment initiative could result in choppiness as we move assets and close underperforming yards. We anticipate revenue to be relatively…
 Loading...