Trends in U.S. crude oil and petroleum product exports For ENERCOM Oil & Gas Conference August 21, 2018 Denver, Colorado By T. Mason Hamilton, Petroleum Markets Analyst, Office of Energy Markets and Financial Analysis U.S.…
Key Takeaways The United States is a net importer of petroleum The decrease in U.S. net petroleum imports is because of increasing exports of petroleum products U.S. crude oil exports have increased but face infrastructure…
The United States is a net importer of petroleum U.S. total petroleum trade (crude oil and petroleum products) Million barrels per day 20 15 10 5 imports net 0 -5 exports -10 2005 2006 2007 2008 2009 2010 2011 2012 2013…
Decrease in U.S. petroleum net imports is because of increased product exports U.S. total petroleum trade (crude oil and petroleum products) Million barrels per day 20 15 petroleum 10 product imports crude oil 5 imports net 0…
Exports of Hydrocarbon Gas Liquids and Distillate are the largest U.S. petroleum exports Total U.S. petroleum exports Million barrels per day 2017 share of total petroleum exports 7 5% residual fuel 6 9% petroleum coke 5 12% other…
Prior to 2017, product exports were responsible for most of the growth in U.S. petroleum exports Year-over-year growth in crude and petroleum product exports Thousand barrels per day 600 Crude oil Motor gasoline Distillate Hydrocarbon…
The current period of U.S. crude oil exports is unlike anything seen in historical data U.S. Crude oil exports Thousand barrels per day 1200 crude oil exports 2017: 1.1 million b/d 1000 800 600 crude oil exports crude oil exports…
Canada, China, and Europe are the top destinations for U.S. crude oil exports U.S. crude oil export destination (2017) Million barrels per day Canada 29% China 20% percent of U.S. total United Kingdom 9% Netherlands 8% South Korea 5%…
U.S. crude oil exports face port and infrastructure limitations T. Mason Hamilton, Oil & Gas Conference, August 21 2018 9
U.S. Crude oil exports continue to increase U.S. crude oil exports U.S. crude oil export destinations (year to date, May 2018) Thousand barrels per day Thousand barrels per day 2,500 China 21% 2,000 Canada 20% 1,500 2017 annual…
Differences in PADD crude oil trade balances are hidden in U.S. numbers U.S. Gulf Coast and Midwest crude oil trade million barrels per day 8 7 6 5 4 Gulf Coast 3 (PADD 3) net imports Midwest 2 (PADD 2) 1 0 net exports…
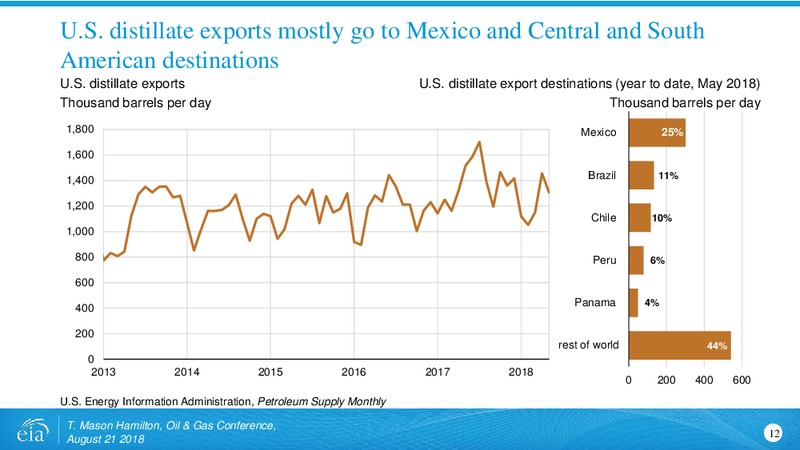
U.S. distillate exports mostly go to Mexico and Central and South American destinations U.S. distillate exports U.S. distillate export destinations (year to date, May 2018) Thousand barrels per day Thousand barrels per day 1,800 Mexico…
Distillate fuel oil is the most widely exported petroleum product from the United States Destinations receiving more than 1,000 b/d of distillate annually from the United States Number of destinations 60 50 40 30 20 10…
EIA now publishes export data by PADD and by destination East Coast (PADD 1) distillate exports Export destinations (year to date, May 2018) Thousand barrels per day Thousand barrels per day 250 East Coast West Coast East Coast (PADD 1)…
More than half of U.S. motor gasoline exports go to Mexico U.S. motor gasoline exports U.S. motor gasoline export destinations (year to date, May 2018) Thousand barrels per day Thousand barrels per day 1,400 Mexico 55% 1,200 Canada…
The United States is on track to become a year-round net gasoline exporter U.S. total motor gasoline trade Thousand barrels per day 2000 1500 1000 500 imports net 0 -500 exports -1000 -1500 2007 2008 2009 2010 2011…
The balance of U.S. net gasoline imports or exports is between East Coast imports and Gulf Coast exports Total motor gasoline trade by PADD Thousand barrels per day 1500 East Coast (PADD 1) 1000 net imports 500 West Coast (PADD…
U.S. Propane exports largely destined for petrochemical facilities in Asia U.S. propane exports U.S. propane export destinations (year to date, May 2018) Thousand barrels per day Thousand barrels per day 1,200 Japan 20% 1,000 Mexico…
HGL exports, supply, and demand changes will become increasingly important to global balances going forward HGL trade Million barrels per day 0.5 net imports 0.0 net exports propane -0.5 ethane -1.0 natural gasoline net…
Thank you For more information Subject matter experts for this presentation: T. Mason Hamilton, Petroleum Markets Analyst, Petroleum Markets Analysis Team, Office of Energy Markets and Financial Analysis Mason.Hamiltoneia.gov,…
For more information U.S. Energy Information Administration home page www.eia.gov This Week in Petroleum www.eia.gov/petroleum/weekly/ Today in Energy www.eia.gov/todayinenergy Annual Energy Outlook www.eia.gov/aeo Short-Term Energy…
 Loading...