BLUE RIDGE MOUNTAIN RESOURCES 2018 Second Quarter August 2018
Blue Ridge Mountain Resources Overview Pure play Utica and Marcellus exploration and production company Production 133 mmscfe/d 79% natural gas Proved reserves 452 bcfe Net resource 4.9 tcfe Net undeveloped 89,000 acres 84%…
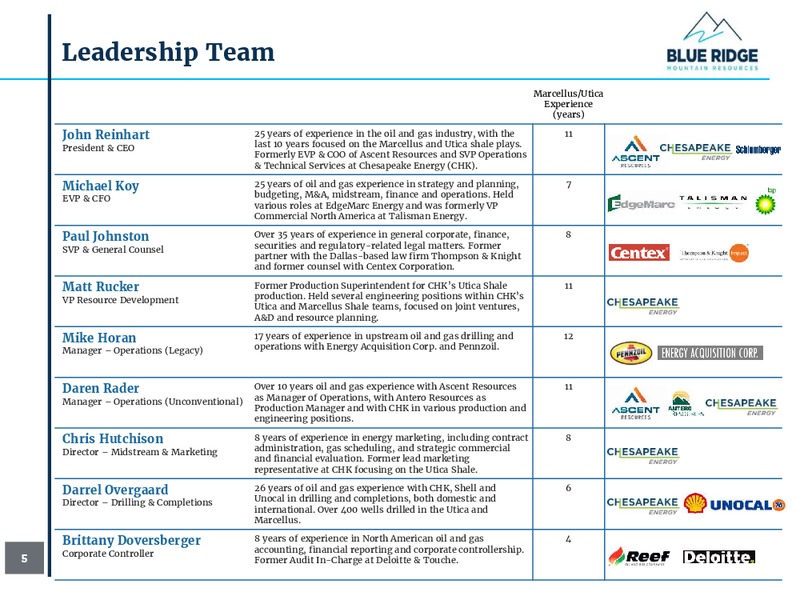
Leadership Team Marcellus/Utica Experience (years) John Reinhart 25 years of experience in the oil and gas industry, with the 11 President & CEO last 10 years focused on the Marcellus and Utica shale plays. Formerly EVP & COO of…
BRMR Strategy Blue Ridge Mountain Resources is positioned to become a leading operator in the Appalachian Basin that performs in the top quartile of EHS, operational and financial performance Utica and Marcellus pure play operator…
BRMR Value Attributes 129,000 net effective acres across the Utica and Marcellus in WV and OH Advantaged Rich and dry gas exposure Asset Base Leases 84% held by production Access to infrastructure with multiple points of egress to…
Mid-Year Proved Reserves (NYMEX) % by Commodity % by Reserve Category % by PV10 Oil NGL PUD PUD PNP PDP PDP Gas PNP Oil Gas NGLs Total PV10 Category Locations (MBBL) (MMCF) (MBBL) (MMCFE) ( millions) PDP 205 596…
Where are we Heading Well Inventory and liquidity to underpin 50-70% Y-o-Y production growth Production (mmscfe/d) EBITDAX ( millions) 2017 2018 2019 2020 2017 2018 2019 2020 Notes: Prices: Gas = 3.00/mmbtu, Oil = 60/bbl,…
Operations Update 11
Update - 2018 Activity 12
Update: Operations Development Operated Lower Ormet (Utica) Stingray White Fleet Started Zipper Frac 6UH & 7UH on 7/21 Completed 70 of 206 total stages (34%) Lower Ormet Pad Anticipate Frac Ops Finished end-August TIL date…
Update - Operations Non Operated Statoil - Isaly (dry gas Utica) 2 well pad Lower Ormet Pad Currently waiting on completions Estimated TIL date of Oct BRMR working interest 13.7% Statoil - Stalder (dry gas Utica) 3 well pad…
Second Quarter 2018 Results and Subsequent Events 15
2Q18 Results Continuing Operations 7 gross wells spudded 6 gross wells turned into line Production Average Realized Price Revenue mmscfe/d /mscfe millions 121.6 3.33 37.3 Production Costs Unit Production Costs millions…
2018 Plan Production of 110 135 mmscfe/d EBITDAX of 50 - 60 million Focus Activity Core asset development 1 operated rig continuous drilling program Retrograde Utica production assessment 2nd operated rig scheduled for 2018…
2018 Plan by Quarter vs Actuals (Red) Production (mmscfe/d) Development Capital Cost ( millions) 200 100 1Q18 68 vs 75 2Q18 121 vs 105 2Q18 1Q18 39 vs 38 100 75 vs 73 50 0 0 4Q17 1Q18 2Q18 3Q18 4Q18 4Q17 1Q18 2Q18…
2018 Sources & Uses of Cash On Track 2018 Sources and Uses of Cash millions Additional debt capacity (3Q) Optionality Other non-revenue 10-15 25-30 Land Divestitures 60-70 Operations 50-60 Undrawn 175-200 Capital debt…
Supplemental Information 23
Gathering, Processing & Transportation Rich Gas Gathered via Eureka Midstream and delivered to Markwest Mobley facility Retrograde 20-70 transported via Blue Racer and delivered to Natrium facility Residual gas Markwest Mobley…
Marcellus Type Curve Areas Rich gas window in West Virginia and Ohio Extensive inventory of low-risk development drilling locations Primarily Operated 55,000 net acres 61 producing wells Ohio = 4 West Virginia = 57…
Utica Type Curve Areas Dry and rich gas windows in Ohio and West Virginia Significant exploration potential in the wet/dry gas window Primarily Operated 66,000 net acres 11 producing wells Ohio = 10 West Virginia = 1…
 Loading...