Investor Presentation The Oil & Gas Conference August 2018 NYSE: LBRT www.LibertyFrac.com
Liberty Snapshot Liberty: The Facts Market leading, returnsfocused provider of Williston Basin hydraulic fracturing services with demonstrably superior financial performance Powder River Basin 13 Fleets Relentless pursuit of…
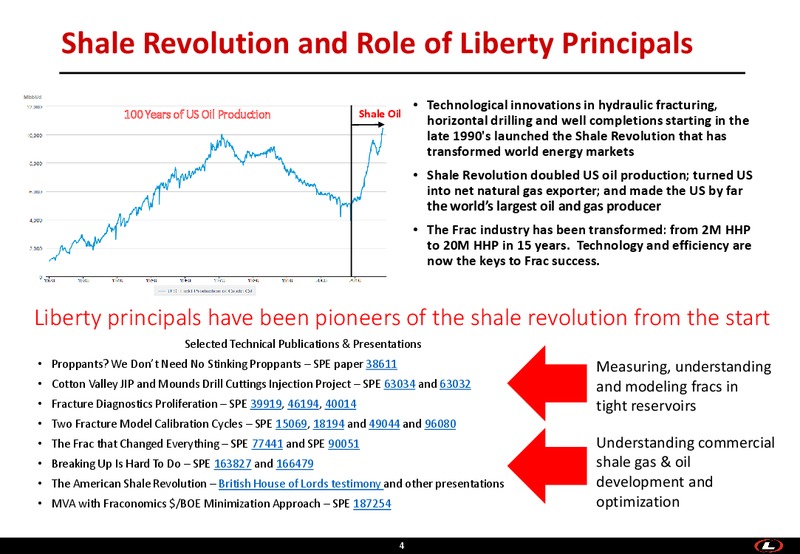
Shale Revolution and Role of Liberty Principals Technological innovations in hydraulic fracturing, 100 Years of US Oil Production Shale Oil horizontal drilling and well completions starting in the late 1990's launched the Shale…
Where we play Hydraulic Fracturing Frac enables production from unconventional reservoirs Largest single component of well capital spend Total Projected 2018 Lower 48 Drilling and Completion Capex Spend1: 90 Billion Breakdown of…
Returns-Focused Company Pre-Tax Return on Capital Employed (ROCE)(1) - LTM 2Q18 Superior Returns 43% on Capital 34% 35% 27% Meticulous Focus on Frac and Frac Only 20% 11% 8% Highly Profitable 7% 5% Operating 0% Structure…
Strong Returns on Capital from Day One Cash Return on Capital Invested (CROCI)(1,2) 55% 51% 47% 44% 45% 35% 29% 25% - 6 Year avg 25% 19% 14% 15% 5% (5%) (1%) 2012 2013 2014 2015 2016 2017 2Q18 YTD…
How We Generate Our Differential Returns 2 Sustaining Free Cash Flow per Fleet People and Culture Treat people right, empower employees, foster an 25.0 22.9 innovation based culture, significantly lower turnover, common sense safety…
The Economics of Frac Companies The Effect of Efficiency High-efficiency frac companies Illustrative Mid-Cycle Frac Rate of Return: generate strong returns when Frac Company Efficiency Low Mid High prudently managed through the cycle…
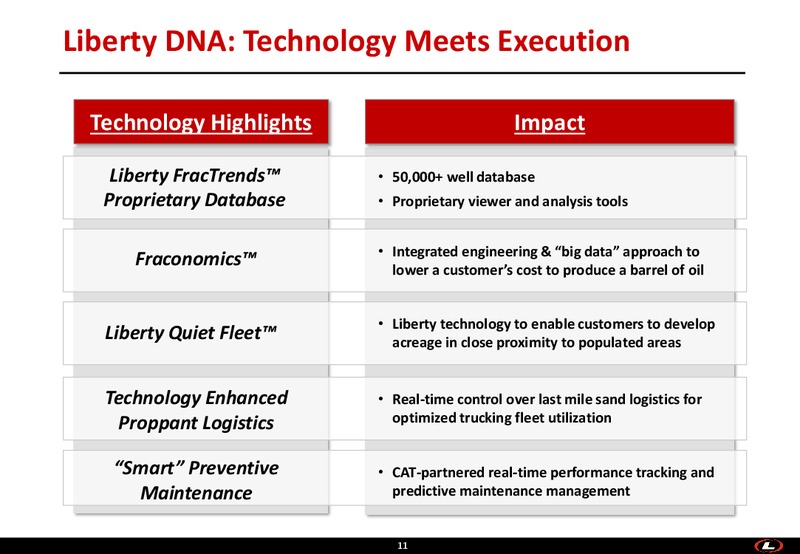
Liberty DNA: Technology Meets Execution Technology Highlights Impact Liberty FracTrends 50,000+ well database Proprietary Database Proprietary viewer and analysis tools Integrated engineering & big data approach to Fraconomics…
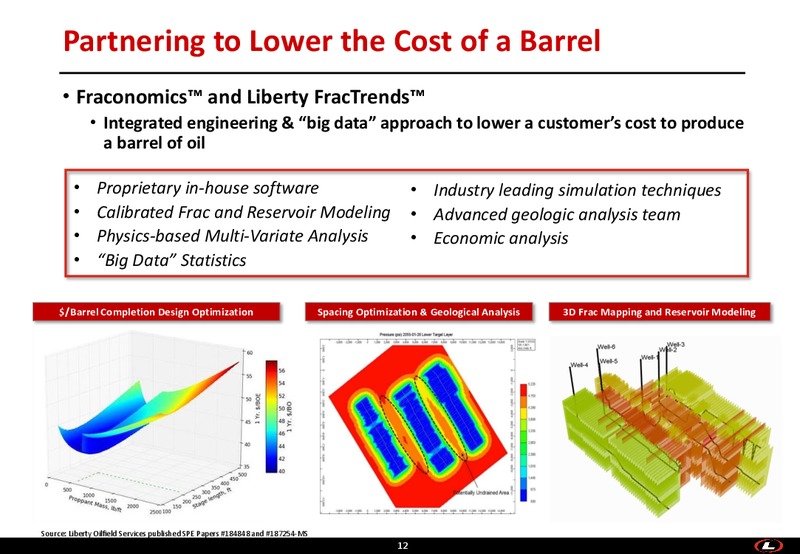
Partnering to Lower the Cost of a Barrel Fraconomics and Liberty FracTrends Integrated engineering & big data approach to lower a customers cost to produce a barrel of oil Proprietary in-house software Industry leading simulation…
Relentless Focus on Operational Efficiency We track all 1,440 minutes on every fleet, Higher Throughput By Lowering Non-Performing Time (NPT) every day Example Pad Customer NPT Meticulous downtime analysis to determine Activity…
Liberty The Employer of Choice Employee-centered culture which attracts and retains high potential talent Get the best talent and you win Lower personnel turnover Zero layoffs during the downturn Safety first - incident rate…
Liberty Purpose-Built Fleet 1.2 Million HHP 1.2 Million HHP in the Field by Q1 2019 Liberty Purpose- Liberty Quiet Liberty High Liberty Pump Down The Liberty Fleet Built Frac Fleets FleetTM Frac Fleets Pressure Frac Fleets & Pump…
What Drives Financial Performance The Way Superior technology, service and safety Utilization Excess demand for Liberty The Right People, Libertized Fleets, Minimize NPT Throughput Partner with customers to accelerate…
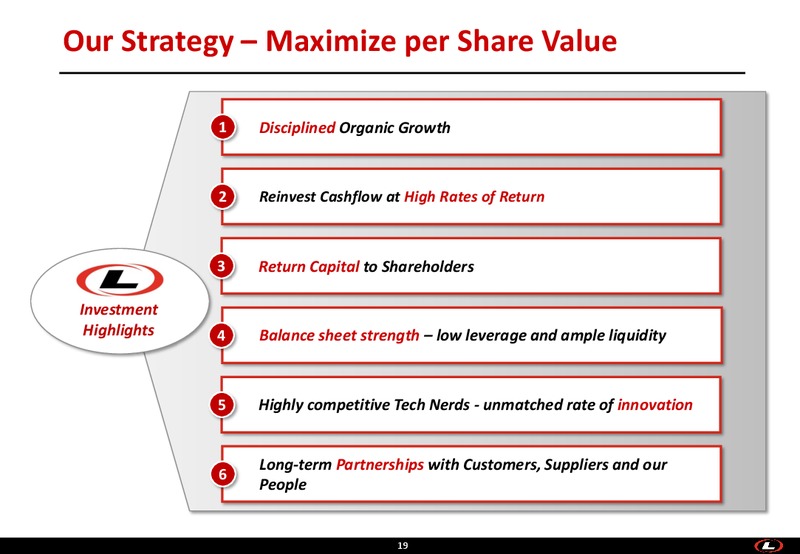
Our Strategy Maximize per Share Value 1 Disciplined Organic Growth 2 Reinvest Cashflow at High Rates of Return 3 Return Capital to Shareholders Investment Highlights 4 Balance sheet strength low leverage and ample…
Appendix NYSE: LBRT www.LibertyFrac.com
Adjusted EBITDA Reconciliation 3 Months Ended 3 Months Ended 3 Months Ended 3 Months Ended Year Ended June 30 2018 Mar. 31 2018 Dec. 31 2017 Sept. 30 2017 Dec. 31 2017 2016 Net Income (loss) 94.7 54.0 57.7 63.7 168.5 (60.6)…
Calculation of Pre-Tax Return on Capital Employed Twelve Months Ended June 30, 2018 Net income 1 270,072 Add back: Income tax expense 24,009 Pre-tax net income 294,081 Capital Employed June 30, 2018 June 30, 2017 Total debt, net of…
 Loading...