October 2018 Investor Update Repositioning to Win Contact: Paige Penchas Vice President, Investor Relations paige_penchasswn.com Phone: (832) 796-4068 NYSE: SWN
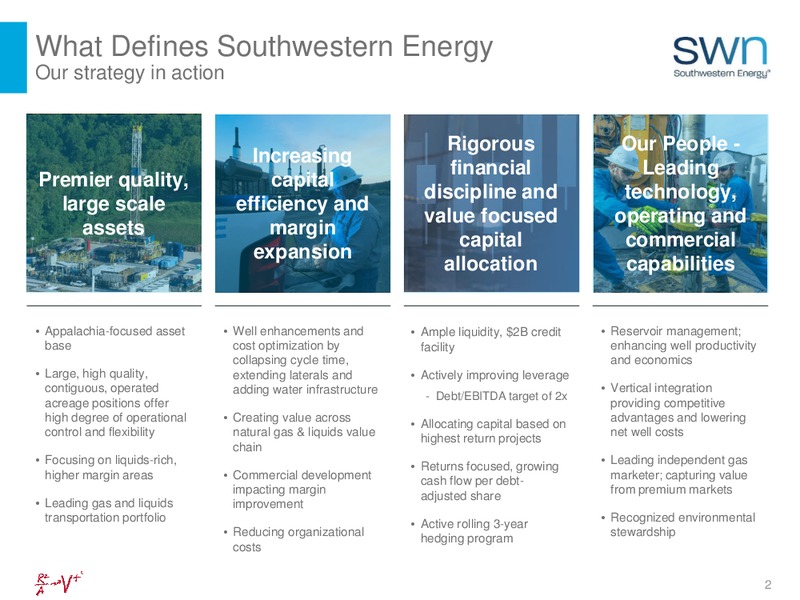
What Defines Southwestern Energy Our strategy in action Rigorous Our People - Increasing financial Leading Premier quality, capital discipline and technology, large scale efficiency and value focused operating and assets margin…
Delivering on Commitments Execution of three-phase strategy Stabilize Optimize and Increase Value Reposition to Compete and Win Strengthened the balance Expanded margins and Reached agreement to sell the sheet improved capital…
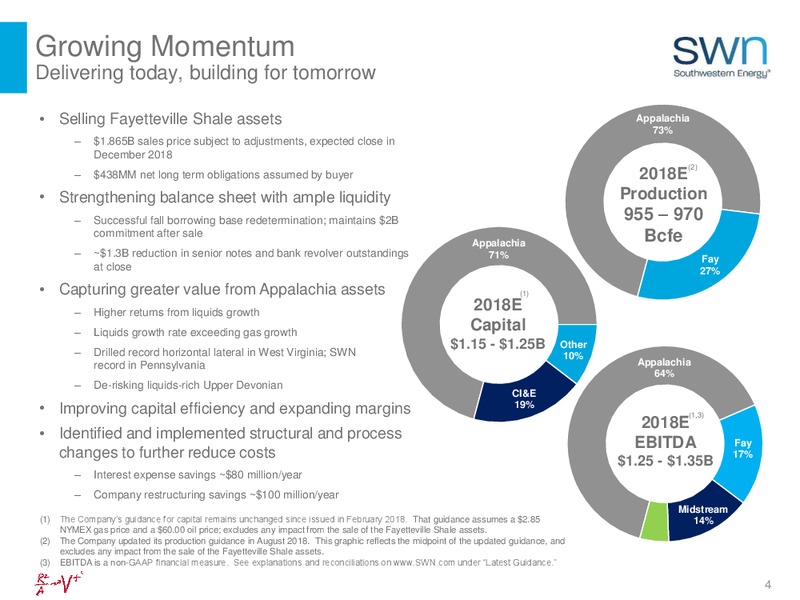
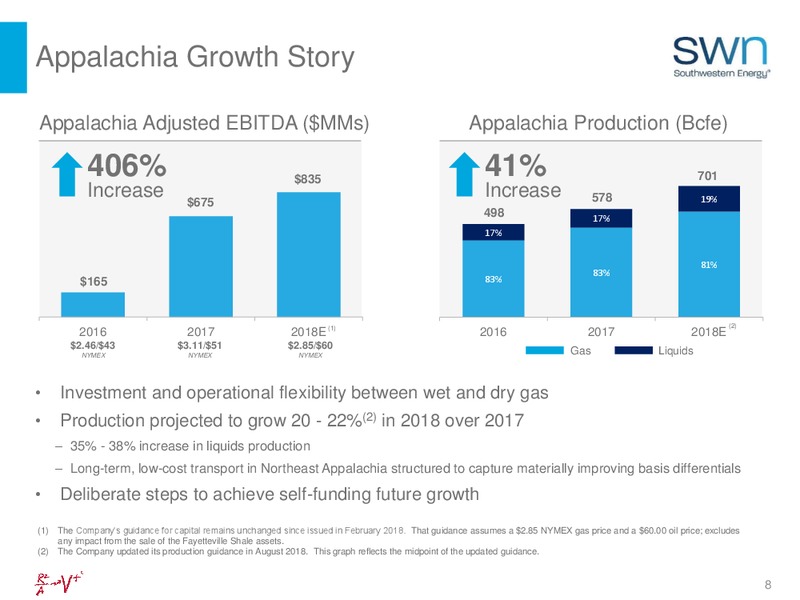
Growing Momentum Delivering today, building for tomorrow Selling Fayetteville Shale assets Appalachia 73% 1.865B sales price subject to adjustments, expected close in December 2018 (2) 438MM net long term obligations assumed by…
Financial Strength Fayetteville proceeds to significantly reduce debt Net Debt / Adjusted EBITDA Pro Forma Debt Maturity Schedule(1) (MM) 2,500 4.5x 2,000 3.6x 3.1x 3.0x 2.8x 1,500 2.7x 2.7x 2.5x 2.0x 1,000 500 No…
Liquids Production and Realizations Higher liquids realizations enrich economics at lower gas prices Liquids production increased by 38% vs Q3 2017 5% 10% Q3 2018 condensate production rate of Ethane 10,850 barrels per day…
Value Growth from Improving Appalachia Basis NE Appalachia Appalachia benefitting from Other Transport 2018 - 0.49 11% M3 2019 - 0.34 17% 2018 - 0.34 26% SW Appalachia 2019 - 0.35 26% improving basis differentials Transport DOM…
Southwest Appalachia Core position in premier play targeting stacked pays Drive value creation through enhanced Super Rich Gas(1) Rich Gas(2) performance Dry Gas 2019 development plan focused on high value liquids-rich inventory…
Southwest Appalachia Increasing capital efficiency, doing more with less in 2018 Average Drilled Lateral Length (ft) Number of Stages Pumped/Day(1) Facility Installation Time (days) 7% 15,559 25% 60 56% Increase Increase 7.4 7.7…
Liquids-Rich Upper Devonian Potential Upper Devonian 9 Tcfe of resource potential 100,000 acres 150 feet above the Marcellus Initial unbound well test (July 2018) Encouraging early results Similar performance to rich Marcellus…
Well Positioned in Core Utica/UPP Acreage Progressing technical understanding of 15+ Tcf of resource potential Cost effectively accelerating learnings through industry data trades Estimated 600MM of trade value Acquired data on…
Northeast Appalachia Delivering value now and in the future Drive value creation through enhanced performance Free cash flow positive asset Enhanced completions efficiency includes increased stages per day, tighter stage spacing…
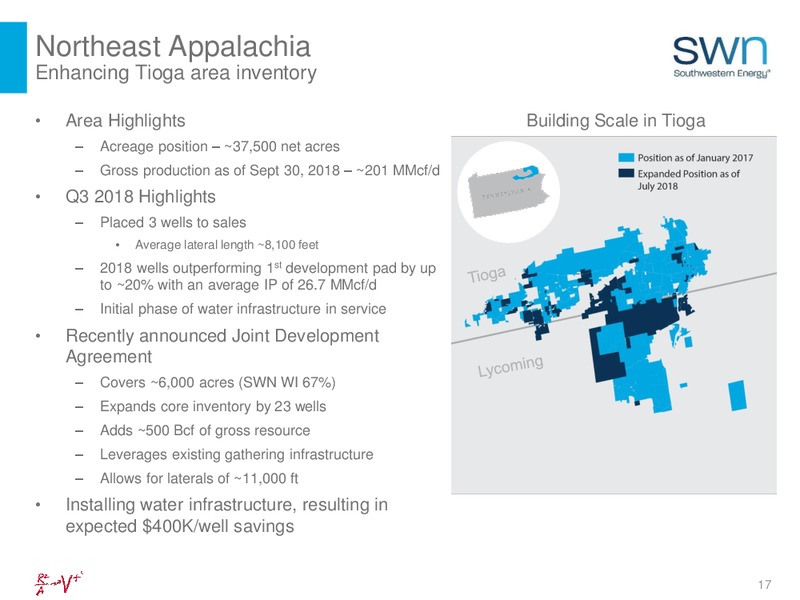
Northeast Appalachia Enhancing Tioga area inventory Area Highlights Building Scale in Tioga Acreage position 37,500 net acres Gross production as of Sept 30, 2018 201 MMcf/d Q3 2018 Highlights Placed 3 wells to sales Average…
Vertical Integration Competitive advantages increase capital efficiency Strategic and economic benefit Progressing water infrastructure project in Southwest Appalachia Provides improved operating efficiency and flexibility…
An Industry Leader in Corporate Responsibility Freshwater neutral since December Reviewed 100% of chemicals used Gold Certification by IES 2016 for operations since 2016 (Independent Energy Standards) Advancing Technology to…
Repositioning to Win Fayetteville sale expected to close Margin expansion through cost December 2018 reductions, improved well productivity, and vertical integration Vast Appalachia acreage, inventory, and growing multi-bench…
Appendix 2121
Environmental, Social and Governance Board independence Management compensation 8 out of 9 directors are independent Independent directors approve compensation Bill Way, President and CEO, is sole non- Mix of awards weighted heavily on…
Improving Proved Developed (PD) Finding & Development Costs PD F&D is a metric that evaluates capital efficiency SWNs PDP F&D has improved by over 40% as a result of: Shifting capital to higher return Appalachia projects Optimizing…
Hedging Protecting cash flow and returns (1) Does not include basis or NGL hedges. Financial NYMEX hedges based on an average swap or purchased put strike price as of September 28, 2018 (2) Amounts may not add due to rounding Note:…
Southwest Appalachia Super Rich Gas Well performance WellSWN Results Exceeding Drilled Expectations & Completed Super Rich Gas(1) Condensate (Normalized to 7,500 ft lateral) Gen 1 Completions (42 wells) 12 BCFe Type Curve 16 BCFe…
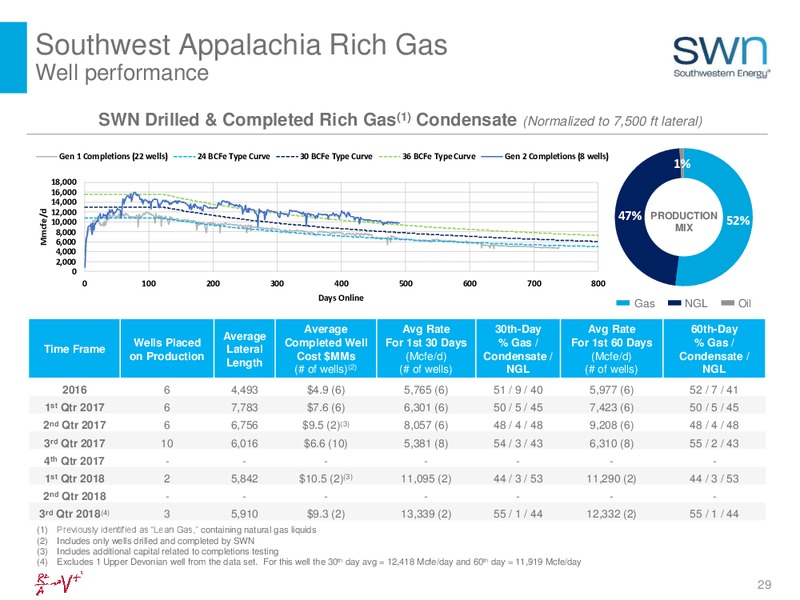
Southwest Appalachia Rich Gas Well performance Well Results Exceeding SWN Drilled Rich Gas(1) Condensate (Normalized to 7,500 ft lateral) Expectations & Completed Gen 1 Completions (22 wells) 24 BCFe Type Curve 30 BCFe Type Curve 36…
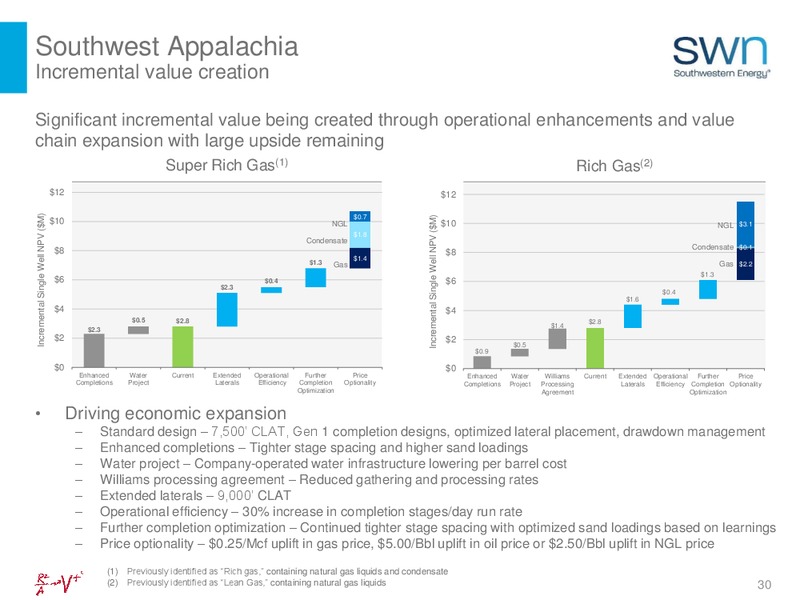
Southwest Appalachia Incremental value creation Significant incremental value being created through operational enhancements and value chain expansion with large upside remaining Super Rich Gas(1) Rich Gas(2) 12 12 Incremental Single…
Northeast Appalachia Well performance SWN Drilled & Completed Dry Gas (Normalized to 6,500 ft lateral) Average Avg Rate Avg Rate Average Wells Placed Completed Well For 1st 30 Days For 1st 60 Days Time Frame Lateral on…
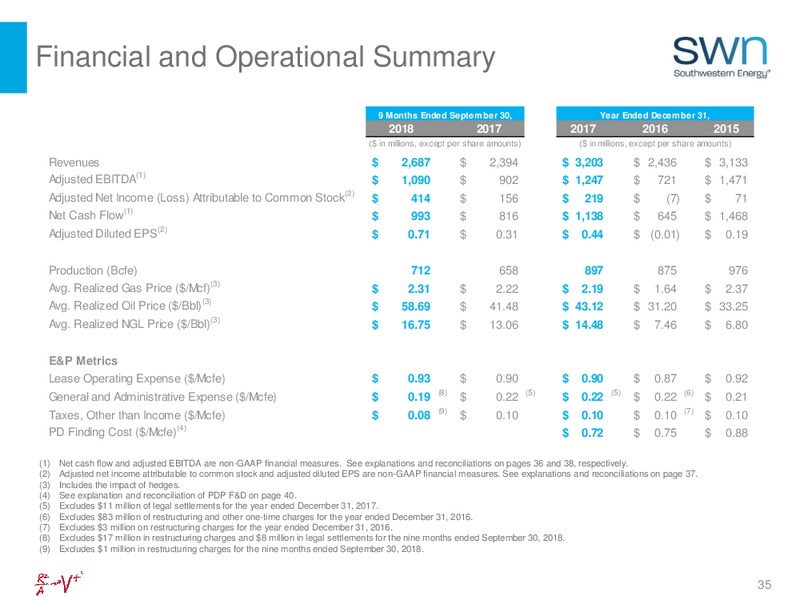
Financial and Operational Summary 9 Months Ended Septem ber 30, Year Ended Decem ber 31, 2018 2017 2017 2016 2015 ( in millions, except per share amounts) ( in millions, except per share amounts) Revenues 2,687 2,394 3,203 2,436…
Explanation and Reconciliation of Non-GAAP Financial Measures: Net Cash Flow We define net cash flow as cash flow from operating activities adjusted for changes in operating assets and liabilities and restructuring charges. Management…
Explanation and Reconciliation of Non-GAAP Financial Measures: Adjusted Net Income Attributable to Common Stock Additional non-GAAP financial measures we may present from time to time are adjusted net income attributable to common stock…
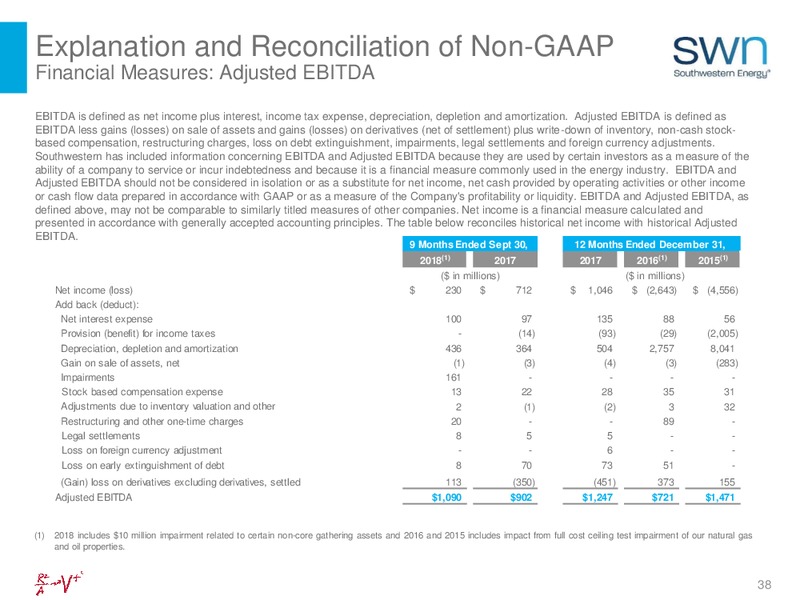
Explanation and Reconciliation of Non-GAAP Financial Measures: Adjusted EBITDA EBITDA is defined as net income plus interest, income tax expense, depreciation, depletion and amortization. Adjusted EBITDA is defined as EBITDA less gains…
Explanation and Reconciliation of Non-GAAP Financial Measures: Net debt / LTM Adj. EBITDA Net debt is defined as short-term debt plus long-term debt less cash and cash equivalents. LTM Adjusted EBITDA is defined as net income plus…
Explanation and Reconciliation: Proved Developed Finding and Development Costs Proved developed (PD) finding and development (F&D) costs are computed here by dividing exploration and development capital costs incurred, excluding…
 Loading...