Strong Financial Performance Shift to Industrial Underway Strong 3Q18 Results Revenue by Segment in 3Q 2018 Contract 3Q18 revenues of 384 million, net income of 70 million Drilling Other and adjusted EBITDA of 184 million(1) 4% 5%…
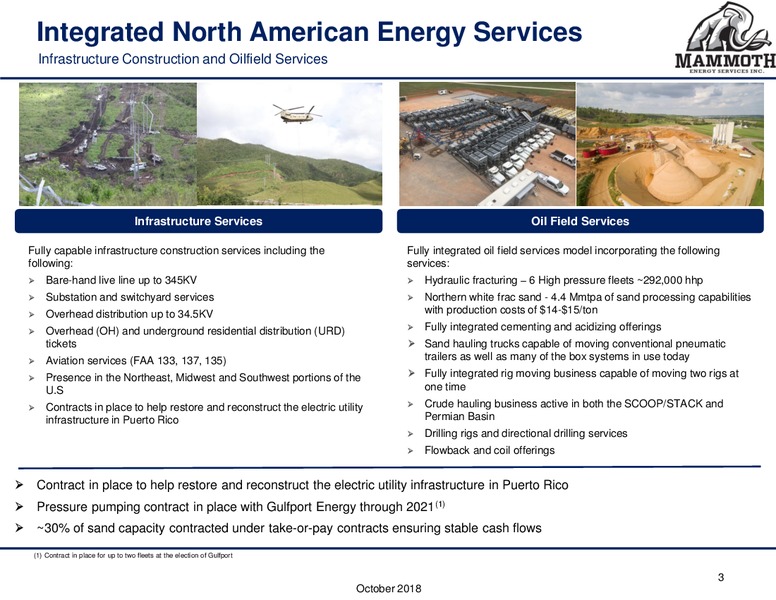
Integrated North American Energy Services Infrastructure Construction and Oilfield Services Infrastructure Services Oil Field Services Fully capable infrastructure construction services including the Fully integrated oil field…
Mammoth Metamorphosis Transition to Industrial Past Present Future Pure Oilfield Service Energy Service Industrial Company Pressure pumping Infrastructure Construction Infrastructure Construction Natural proppant Transmission…
History of Strong Financial Performance Clean Balance Sheet Allows for Growth Debt (Year-end) (MM) Cash (Year-end) (MM) Revenues and EBITDA (MM) 146 Revenue EBITDA 1,412 29 100 961 95 20 17 12 10 463 40 368 6 276 231…
Mammoth Value Creation Focused on Return on Capital 10/14/2016 (IPO Date) 10/26/2018 Market Capitalization Up 131% 500 Million 1.2 Billion 10/14/2016 (IPO Date) 10/26/2018 120% Outperformance vs OSX 13.26/share 70% Outperformance…
TUSK Well Positioned vs Peers Compelling Value Compelling value opportunity versus peers EV / 2019 EBITDA (Consensus Estimates) (2) Trading at discount to peer group despite superior balance sheet and service diversification 9.5x…
Appendix
Capex Budget Focused on Growing Organically 2018 Major Projects 2018 Capex (in Millions) Organically growing the continental U.S. infrastructure business 21 by roughly 100%, ultimately dependent on contract coverage Pressure…
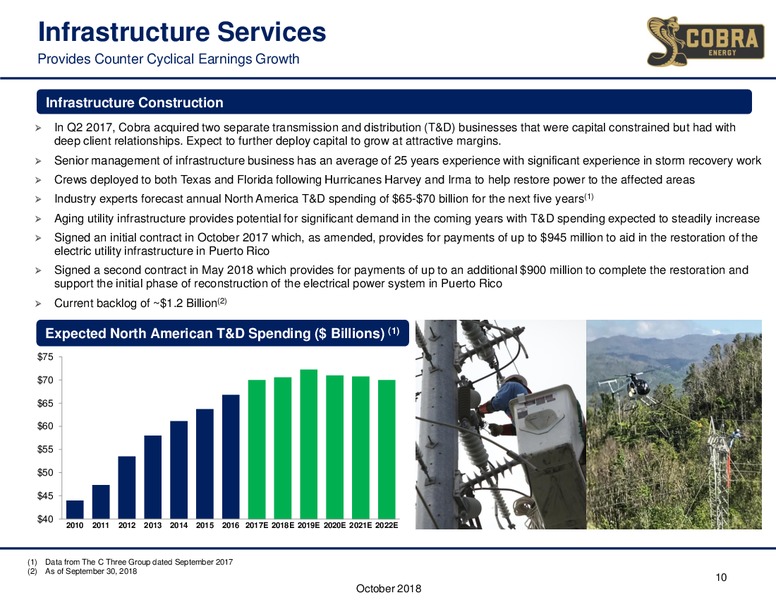
Infrastructure Services Provides Counter Cyclical Earnings Growth Infrastructure Construction In Q2 2017, Cobra acquired two separate transmission and distribution (T&D) businesses that were capital constrained but had with deep…
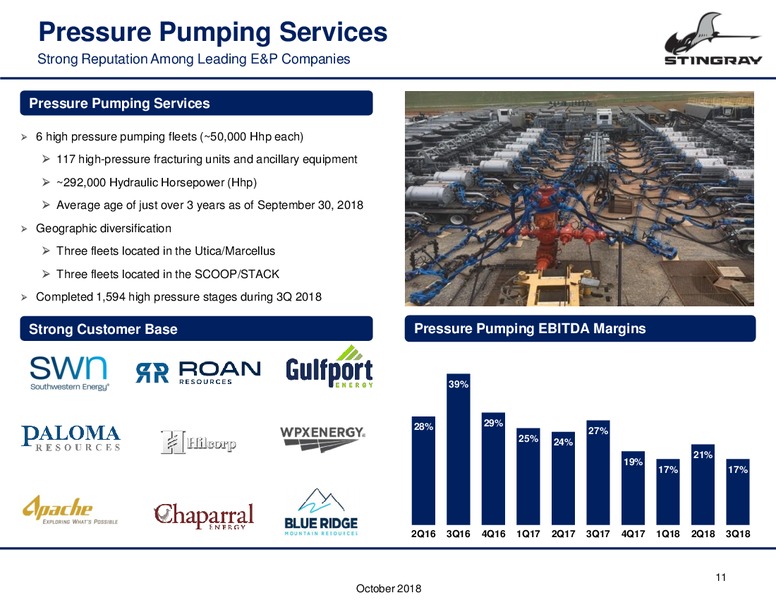
Pressure Pumping Services Strong Reputation Among Leading E&P Companies Pressure Pumping Services 6 high pressure pumping fleets (50,000 Hhp each) 117 high-pressure fracturing units and ancillary equipment 292,000 Hydraulic…
Natural Sand Proppant Services 4.4 Million Tons Per Annum (Mmtpa) of Processing Capacity Services Summary Take-or-pay contracts in place covering 30% of expected volumes, at attractive pricing Total effective processing capacity of…
US Rig Count Driving Pressure Pumping Demand Service Intensity Driving Larger Pressure Pumping Fleets Rig count & efficiency driving frac demand US Rig Count 1,600 Rig efficiencies and longer laterals are driving the need for more…
History of The Mammoth Energy Portfolio Steady Organic Development and Diversification Mammoth has created a platform where management teams can flourish Built to support in-demand services for unconventional resources in…
Adjusted EBITDA Reconciliation Three Months Three Months Reconciliation of Adjusted EBITDA to net income (000s) Ended Ended September 30, 2018 September 30, 2017 Net Income (Loss) 69,512 (801) Depreciation, Depletion, Accretion…
Company Headquarters 14201 Caliber Drive, Suite 300 Oklahoma City, OK 73134 405-608-6007 investorsmammothenergy.com 16 October 2018
 Loading...