Opening Comments Reported third-quarter earnings of 737 million or 1.62 per share Focus on operational excellence and disciplined capital strategy 3.2 billion returned to shareholders through the third quarter Closed Andeavor…
Third-Quarter Highlights Reported third-quarter earnings of 737 million, or 1.62 per diluted share, and income from operations of 1,403 million Refining & Marketing: segment income from operations of 666 million, driven by 97 percent…
Speedway Conversion Retail has converted roughly 90 stores to Speedway in October and expect to complete approximately 200 sites by the end of 2018 5
Third-Quarter 2018 Earnings 3Q 2018 3Q 2017 Earnings* 737 MM 903 MM Earnings per Diluted Share* 1.62 1.77 Earnings* Earnings per Diluted Share* 3.92 2,000 1,829 4 1,500 1,416 1.62 737 3 2.73 /Share MM 1,000 903 2…
Earnings* 3Q 2018 vs. 3Q 2017 Variance Analysis 1,000 903 900 193 800 324 737 700 (20) (103) 600 (82) MM 500 400 (431) (47) 300 200 100 0 3Q 2017 Refining & Speedway Midstream** Items not Interest and Income…
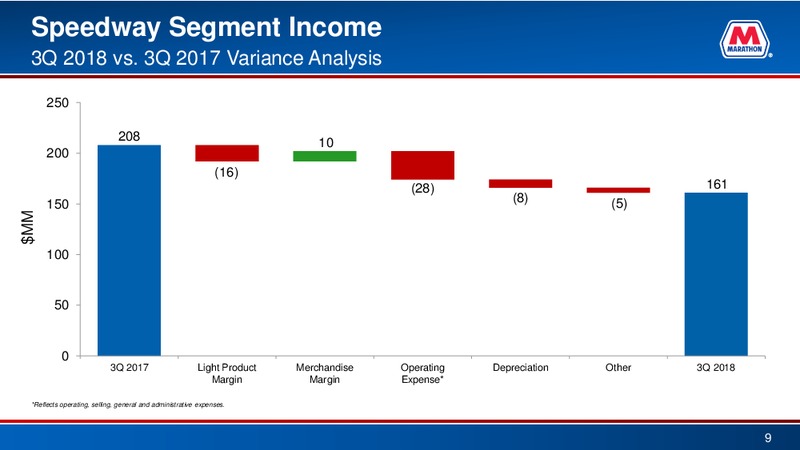
Speedway Segment Income 3Q 2018 vs. 3Q 2017 Variance Analysis 250 208 10 200 (16) (28) 161 150 (8) (5) MM 100 50 0 3Q 2017 Light Product Merchandise Operating Depreciation Other 3Q 2018 Margin Margin Expense*…
Midstream Segment Income 3Q 2018 vs. 3Q 2017 Variance Analysis 800 361 700 679 (37) 600 500 MM 400 355 300 200 100 0 3Q 2017 MPLX*,** MPC Retained Equity and Other 3Q 2018 Affiliates** *Results related to refining…
Total Consolidated Cash Flow 3Q 2018 8,000 994 7,000 1,590 6,000 (408) 4,999 (1,406) 31 4,992 5,000 (607) (201) MM 4,000 3,000 2,000 1,000 0 6/30/2018 Operating Working Net Debt Cash Capital Return of Net…
Capitalization and Select Cash-Flow Data MPC MPC MPLX As of September 30, 2018 Excluding Consolidated Adjustments(a) (MM except ratio data) MPLX Debt 18,449 12,890 5,559 Mezzanine equity 1,003 1,003 - Equity 19,031 8,367 10,664…
Illustrative 2018 Capital Forecast We intend to provide 4th quarter and 2019 guidance at our Investor Day in December as well as provide preliminary reporting framework ( MM) Previous(a) Current(a) MPC (excluding MPLX) 1,600 1,600…
Appendix 14
Earnings 2017 2018 (a)OnFebruary 1, 2018, we contributed (MM unless otherwise noted) certain refining logistics assets and fuels 4Q 1Q 2Q 3Q distribution services to MPLX. The results of these businesses are reported Refining &…
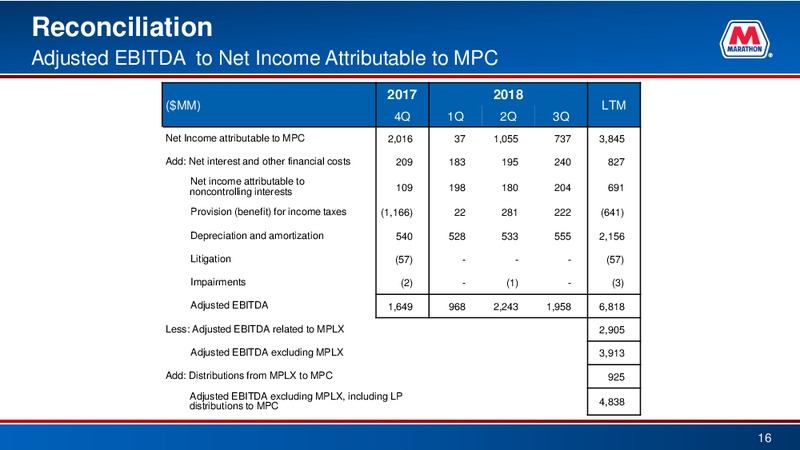
Reconciliation Adjusted EBITDA to Net Income Attributable to MPC 2017 2018 (MM) LTM 4Q 1Q 2Q 3Q Net Income attributable to MPC 2,016 37 1,055 737 3,845 Add: Net interest and other financial costs 209 183 195 240 827 Net income…
Reconciliation Adjusted EBITDA Related to MPLX to MPLX Net Income 2017 2018 (MM) LTM 4Q 1Q 2Q 3Q MPLX Net Income 241 423 456 516 1,636 Add: Net interest and other financial costs 96 130 151 153 530 Provision (benefit) for…
Cash Provided from Operations Before Changes in Working Capital Reconciliation to Net Cash Provided by Operations 2017 2018 (MM) 4Q 1Q 2Q 3Q Net cash provided by (used in) operations(a) 2,745 (137) 2,386 1,182 Less changes in…
Reconciliation of Refining & Marketing Margin to Refining & Marketing Income from Operations (MM) 3Q 2018 3Q 2017 Refining & Marketing income from operations 666 1,097 Plus: Refinery direct operating costs(a) 992 933 Refinery…
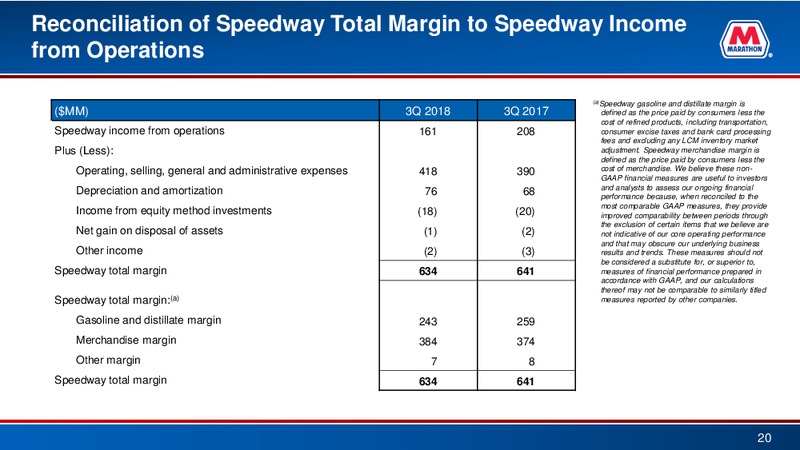
Reconciliation of Speedway Total Margin to Speedway Income from Operations (a)Speedway gasoline and distillate margin is (MM) 3Q 2018 3Q 2017 defined as the price paid by consumers less the cost of refined products, including…
 Loading...