3Q18 Earnings Call Presentation NOVEMBER 1, 2018 1
3Q18 Operational Highlights Experienced consolidated Adjusted EBITDA margin improvement off July lows as cost control measures gained traction Driven by our returns focused strategy, we idled two horizontal frac fleets and reduced…
3Q18 Operational Highlights (continued) Maintained capital discipline and protected strong balance sheet and liquidity position Reduced Adjusted SG&A expense 13% year-over-year and sequentially generating 70 basis points of operating…
3Q18 Financial Highlights & Market Conditions 3Q18 Market Conditions Consolidated Revenue Year-over-year revenue and Adjusted EBITDA increased 28% ( in millions) and 66%, respectively; however, results declined sequentially 611 553…
3Q18 Revenue Overview Revenue by Business Revenue by Basin Fluids Management 6% 5% Rig Services 12% 11% Coiled Tubing 40% 5% 44% Fracturing 10% Cementing 12% 11% Other 1% Completions 23% 20% Wireline & Pumping…
Well Construction & Intervention Services Segment Overview 3Q18 Highlights Reported Segment Revenue ( in millions) Segment revenue increased 167% year-over-year to 95.7 million largely due to the O-Tex Pumping 99 96 acquisition in…
Well Support Services Segment Overview 3Q18 Highlights Reported Segment Revenue Segment revenue was essentially flat year-over-year ( in millions) and sequentially at 99.0 million 98 99 99 92 91 Segment Adjusted EBITDA increased…
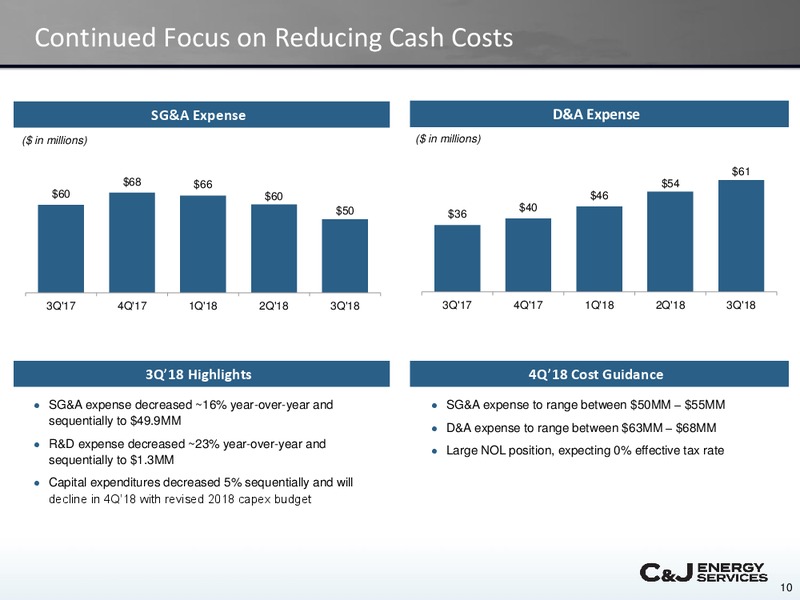
Continued Focus on Reducing Cash Costs SG&A Expense D&A Expense ( in millions) ( in millions) 61 68 66 54 60 60 46 50 40 36 3Q'17 4Q'17 1Q'18 2Q'18 3Q'18 3Q'17 4Q'17 1Q'18 2Q'18 3Q'18 3Q18 Highlights 4Q18 Cost…
Strong Capital Structure and Reasonable Growth Plan No Leverage and Ample Liquidity 2018 Capital Budget & Highlights(1) ( in millions) 466 414 393 Maintenance Fracturing Fleet Reactivations 32% 32% 356 326 317 88 110 76…
Thoughts on the Forward Outlook 4Q18 Outlook Preliminary 2019 Thoughts Expecting consolidated revenue and Adjusted EBITDA to Remain focused on dedicating multiple frac fleets with long- decline sequentially due to continued weakness in…
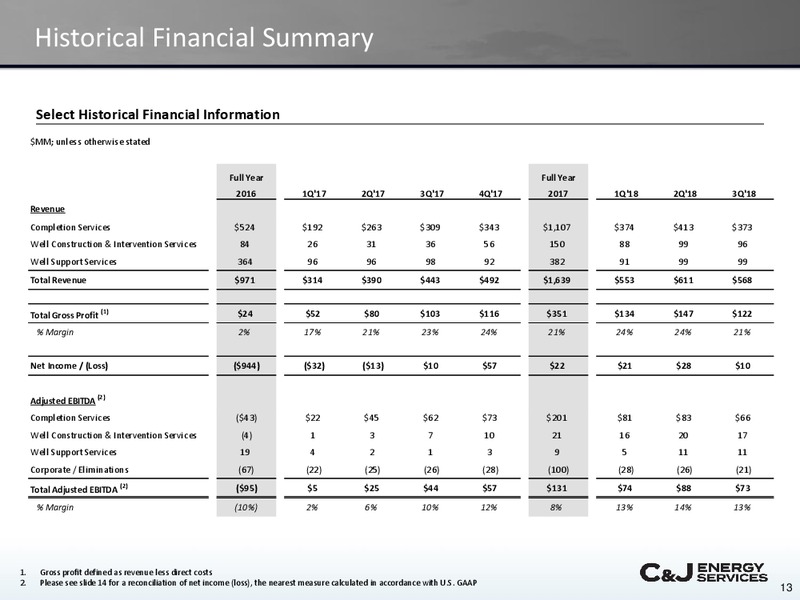
Historical Financial Summary Select Historical Financial Information MM; unless otherwise stated Full Year Full Year 2016 1Q'17 2Q'17 3Q'17 4Q'17 2017 1Q'18 2Q'18 3Q'18 Revenue Completion Services 524 192 263 309 343 1,107 374…
Non-GAAP Reconciliation Adjusted EBITDA Reconciliation* MM Full Year Full Year 2016 1Q'17 2Q'17 3Q'17 4Q'17 2017 1Q'18 2Q'18 3Q'18 Net income / (loss) (944) (32) (13) 10 57 22 21 28 10 Interest expense, net 157 1 0 0 0 2 0 2 1 Income…
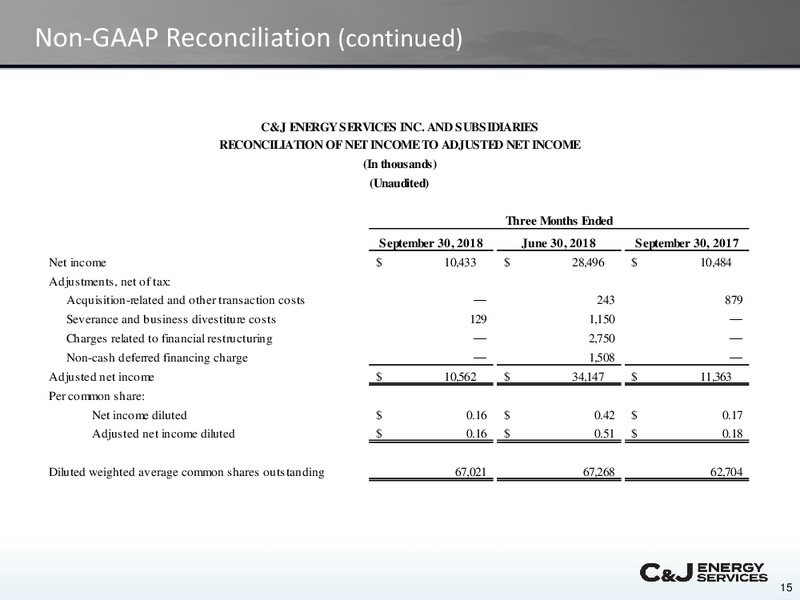
Non-GAAP Reconciliation (continued) C&J ENERGY SERVICES INC. AND SUBSIDIARIES RECONCILIATION OF NET INCOME TO ADJUSTED NET INCOME (In thousands) (Unaudited) Three Months Ended September 30, 2018 June 30, 2018 September 30, 2017…
Non-GAAP Reconciliation (continued) C&J ENERGY SERVICES INC. AND SUBSIDIARIES RECONCILIATION OF SG&A TO ADJUSTED SG&A (In thousands) (Unaudited) Three Months Ended September 30, 2018 June 30, 2018 September 30, 2017 SG&A 49,870…
C&J Tenants: The Differentiated U.S. Oilfield Services Company Leading Diversified Modern, High-Quality 1 Service Provider in most 2 Asset Base U.S. Land Basins Established and Growing Focused on Quality, Safe 3 and Reliable…
 Loading...