Third quarter 2018 earnings call Neil Hansen Vice President, Investor Relations and Secretary November 2, 2018 RESTRICTED DISTRIBUTION UNTIL November 2, 2018 7:00am 11/1/2018 4:30 PM
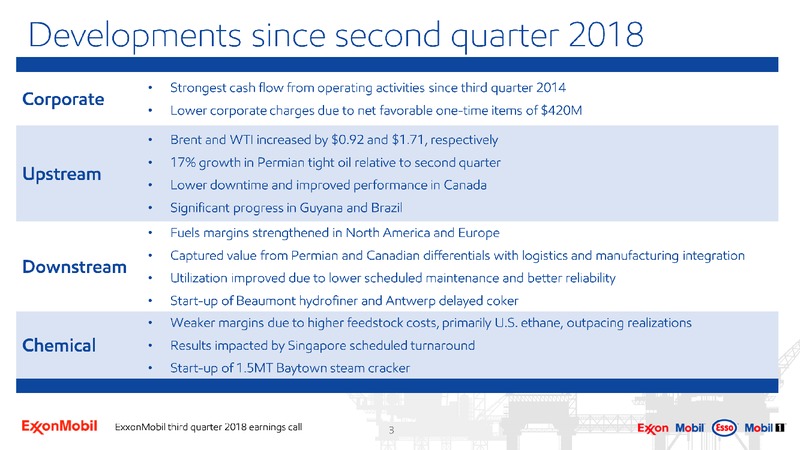
Developments since second quarter 2018
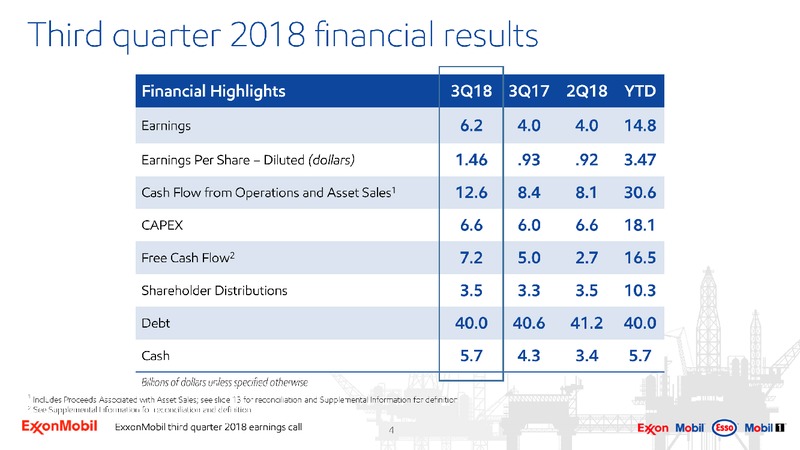
Third quarter 2018 financial results 1 Includes Proceeds Associated with Asset Sales; see slide 13 for reconciliation and Supplemental Information for definition 2 See Supplemental Information for reconciliation and definition
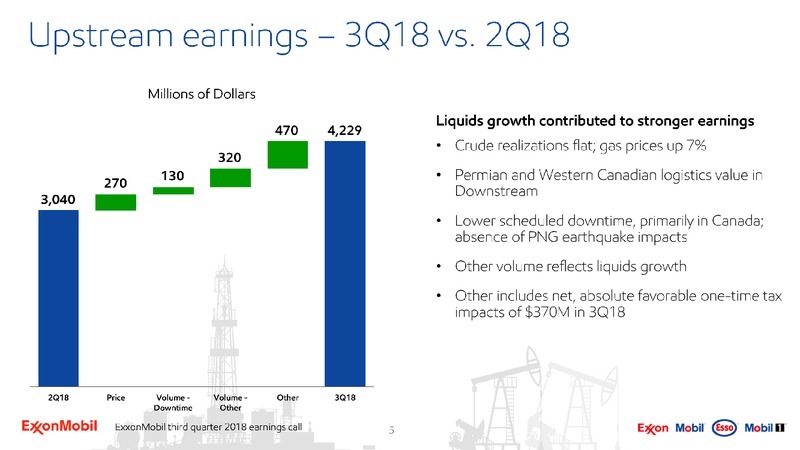
Upstream earnings 3Q18 vs. 2Q18 3,040 320 4,229 Millions of Dollars 270 Liquids growth contributed to stronger earnings Crude realizations flat; gas prices up 7% Permian and Western Canadian logistics value in Downstream Lower…
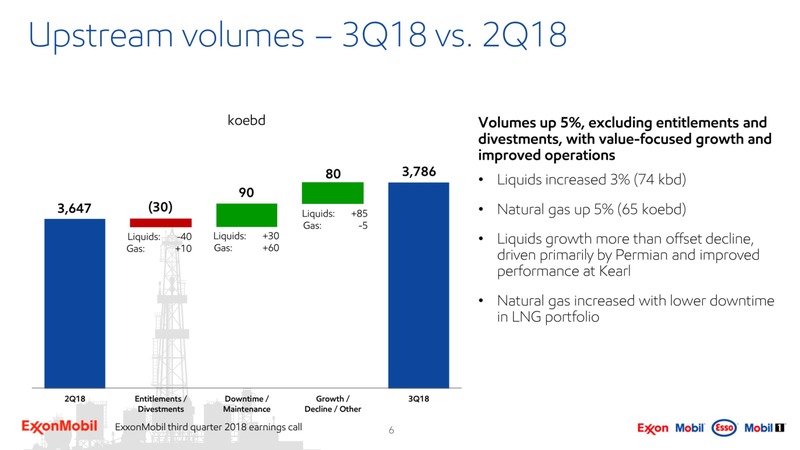
koebd 3,647 (30) 3,786 80 90 Upstream volumes 3Q18 vs. 2Q18 Volumes up 5%, excluding entitlements and divestments, with value-focused growth and improved operations Liquids increased 3% (74 kbd) Natural gas up 5% (65 koebd) Liquids…
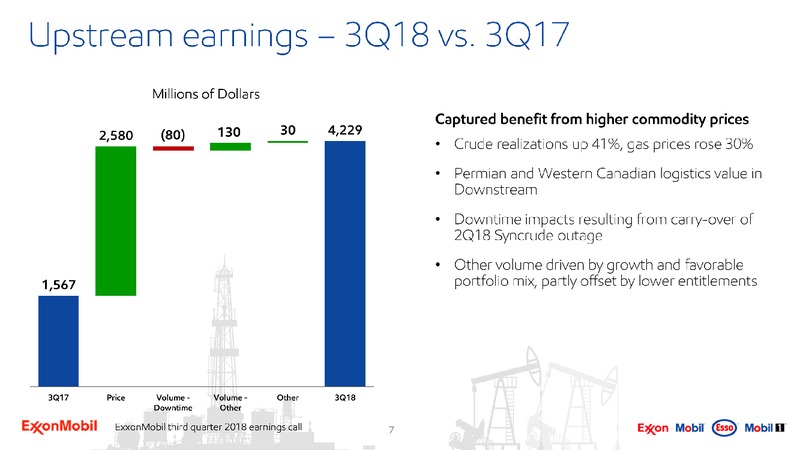
Upstream earnings 3Q18 vs. 3Q17 1,567 2,580 130 4,229 30 Millions of Dollars (80) Captured benefit from higher commodity prices Crude realizations up 41%, gas prices rose 30% Permian and Western Canadian logistics value in…
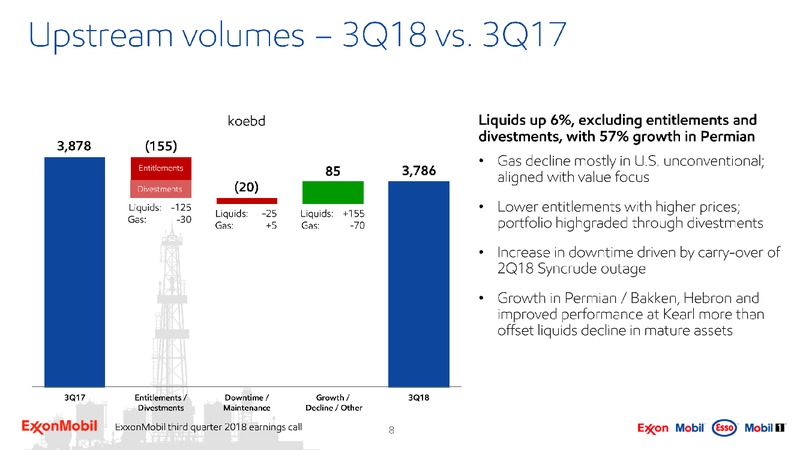
Upstream volumes 3Q18 vs. 3Q17 koebd 3,878 (155) (20) 3,786 Liquids up 6%, excluding entitlements and divestments, with 57% growth in Permian Gas decline mostly in U.S. unconventional; aligned with value focus Lower entitlements with…
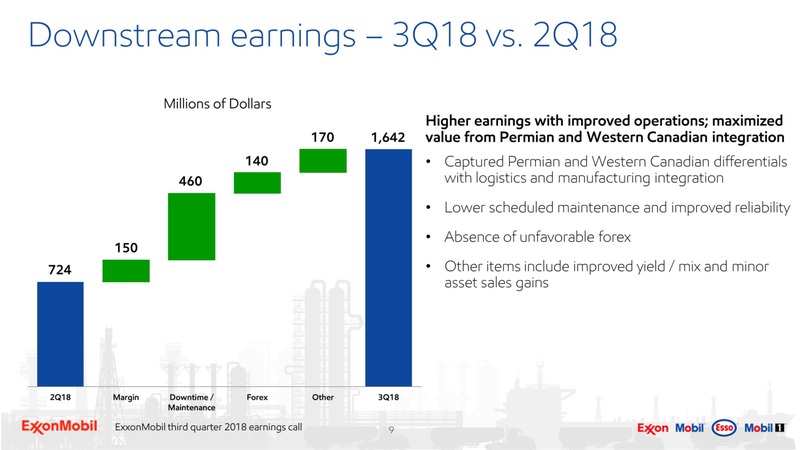
724 150 1,642 140 Millions of Dollars Downstream earnings 3Q18 vs. 2Q18 Higher earnings with improved operations; maximized value from Permian and Western Canadian integration Captured Permian and Western Canadian differentials with…
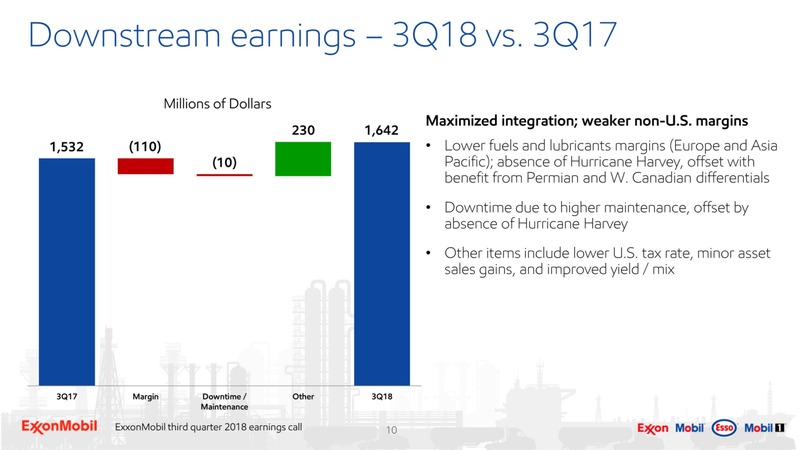
1,532 (110) 1,642 (10) Millions of Dollars Downstream earnings 3Q18 vs. 3Q17 230 Maximized integration; weaker non-U.S. margins Lower fuels and lubricants margins (Europe and Asia Pacific); absence of Hurricane Harvey, offset with…
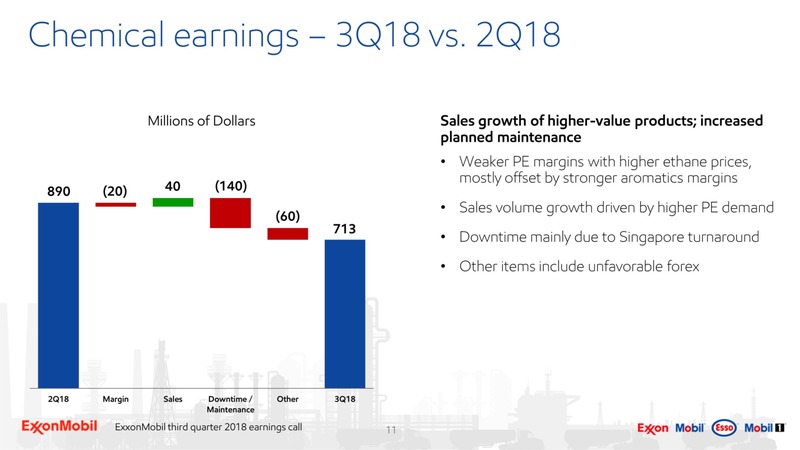
Chemical earnings 3Q18 vs. 2Q18 Millions of Dollars Sales growth of higher-value products; increased planned maintenance Weaker PE margins with higher ethane prices, mostly offset by stronger aromatics margins Sales volume growth…
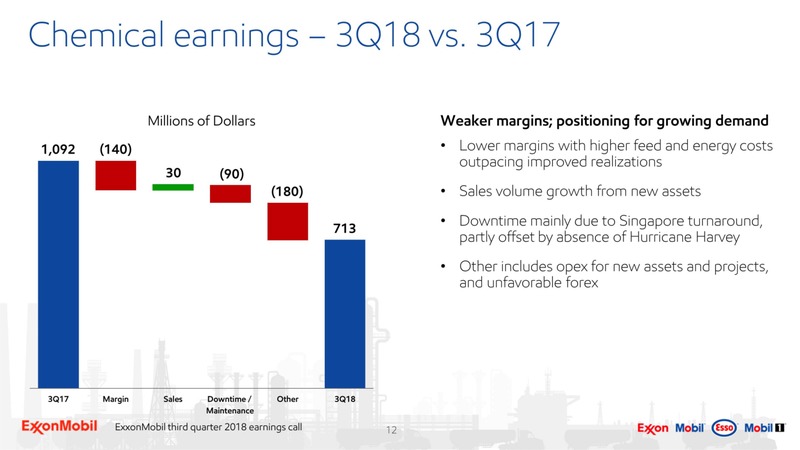
Chemical earnings 3Q18 vs. 3Q17 Millions of Dollars 30 (90) (180) Weaker margins; positioning for growing demand Lower margins with higher feed and energy costs outpacing improved realizations Sales volume growth from new assets…
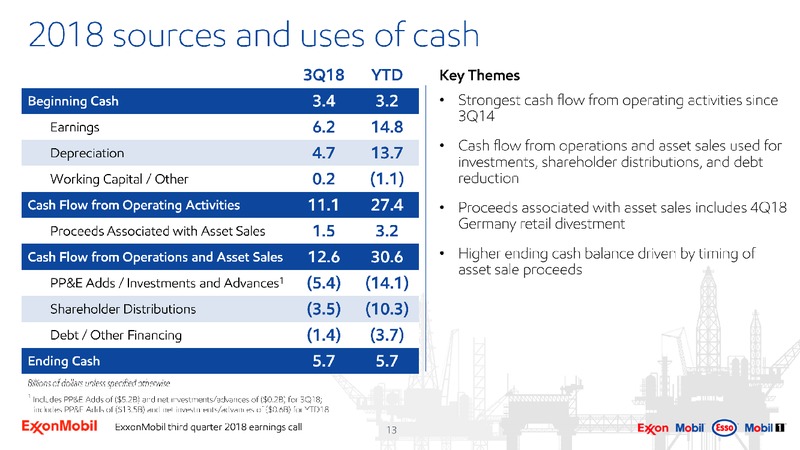
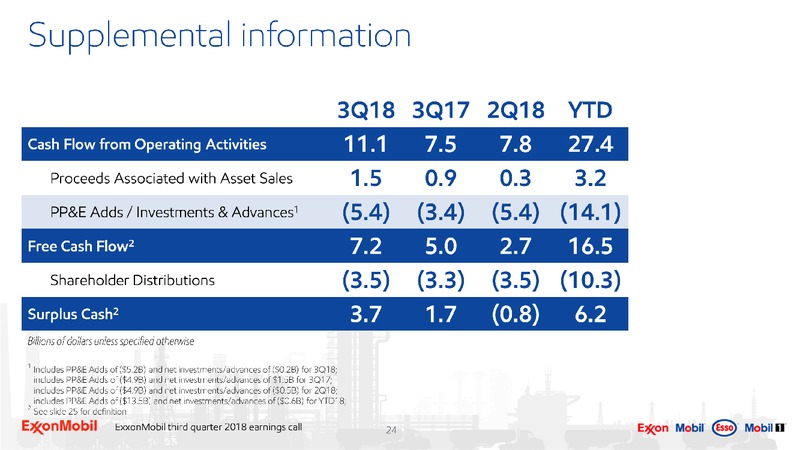
2018 sources and uses of cash Key Themes Strongest cash flow from operating activities since 3Q14 Cash flow from operations and asset sales used for investments, shareholder distributions, and debt reduction Proceeds associated with…
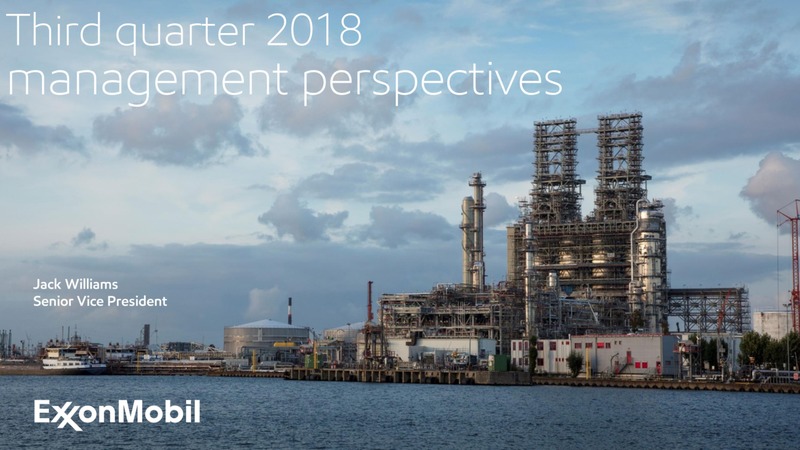
Third quarter 2018 management perspectives Jack Williams Senior Vice President
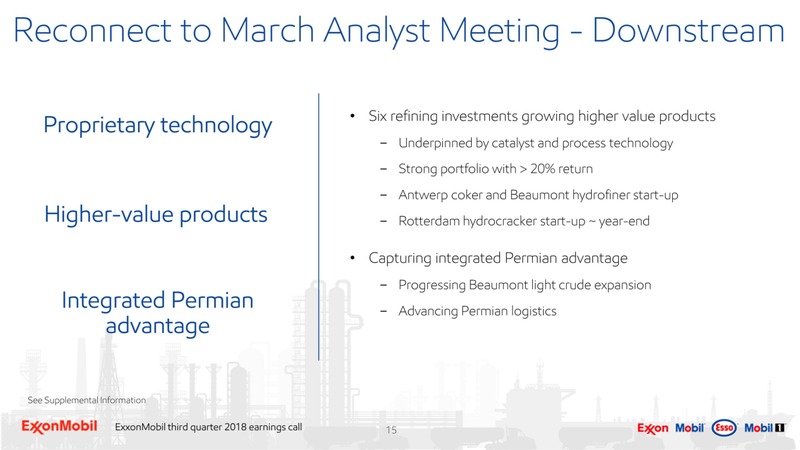
Reconnect to March Analyst Meeting - Downstream Six refining investments growing higher value products Underpinned by catalyst and process technology Strong portfolio with 20% return Antwerp coker and Beaumont hydrofiner start-up…
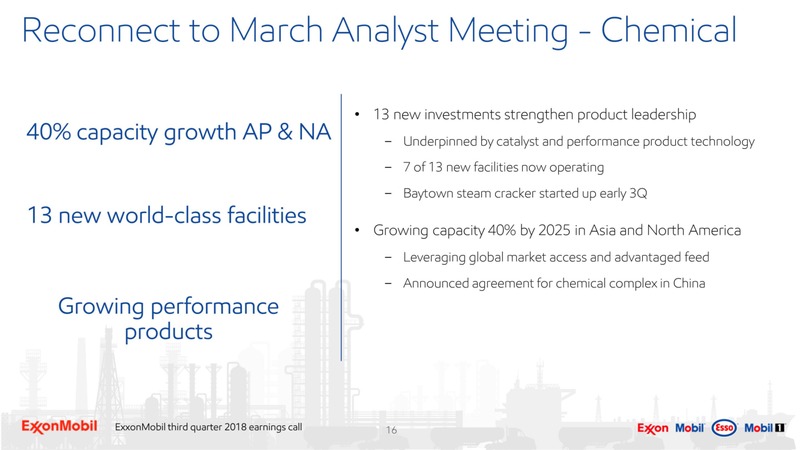
Reconnect to March Analyst Meeting - Chemical Growing performance products 40% capacity growth AP & NA 13 new world- class facilities 13 new investments strengthen product leadership Underpinned by catalyst and performance product…
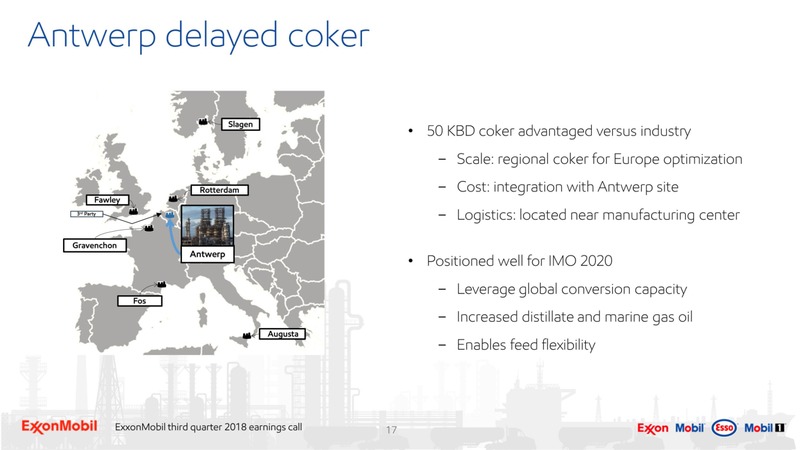
Antwerp delayed coker 50 KBD coker advantaged versus industry Scale: regional coker for Europe optimization Cost: integration with Antwerp site Logistics: located near manufacturing center Positioned well for IMO 2020 Leverage…
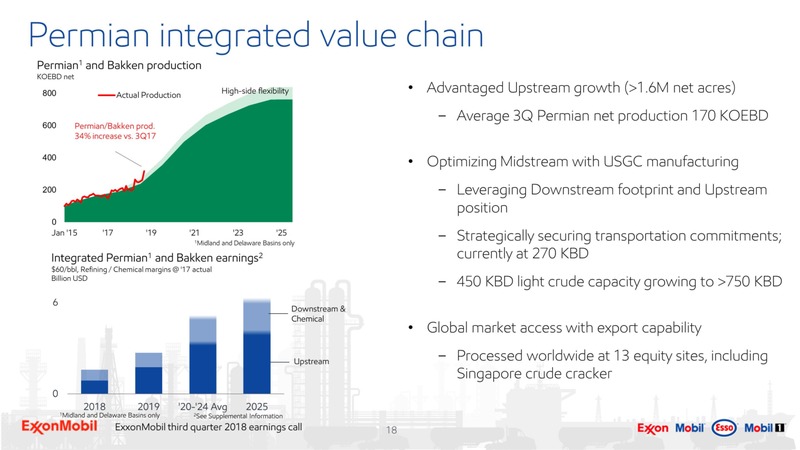
Permian integrated value chain Advantaged Upstream growth (1.6M net acres) Average 3Q Permian net production 170 KOEBD Optimizing Midstream with USGC manufacturing Leveraging Downstream footprint and Upstream position Strategically…
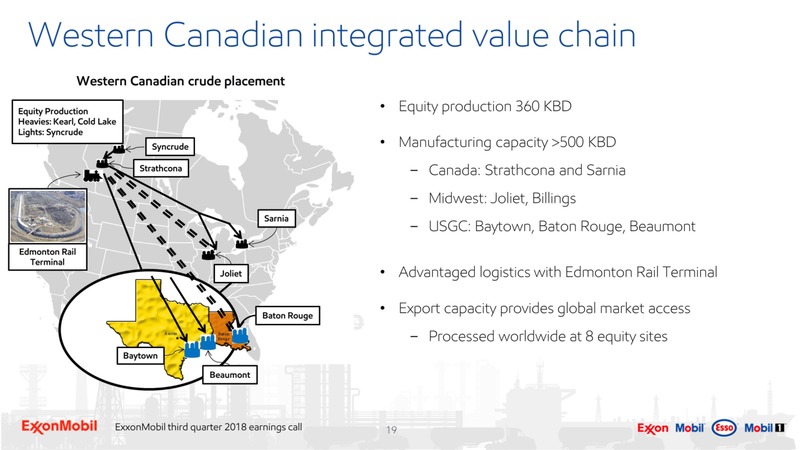
Western Canadian integrated value chain Equity production 360 KBD Manufacturing capacity 500 KBD Canada: Strathcona and Sarnia Midwest: Joliet, Billings USGC: Baytown, Baton Rouge, Beaumont Advantaged logistics with Edmonton Rail…
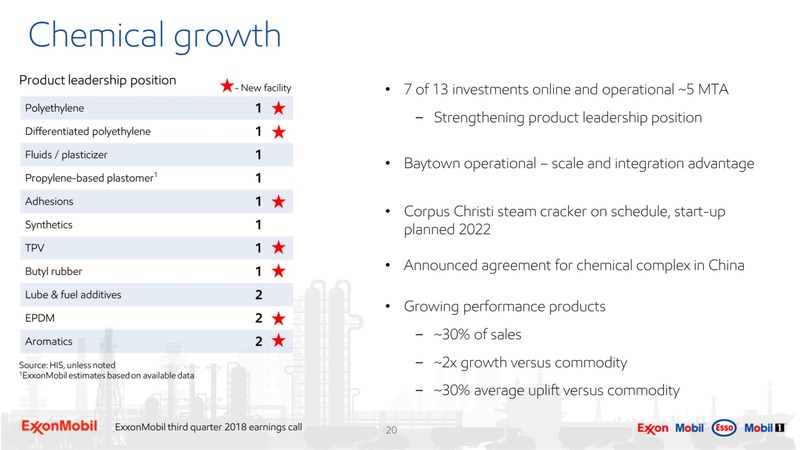
Chemical growth 7 of 13 investments online and operational 5 MTA Strengthening product leadership position Baytown operational scale and integration advantage Corpus Christi steam cracker on schedule, start-up planned 2022…
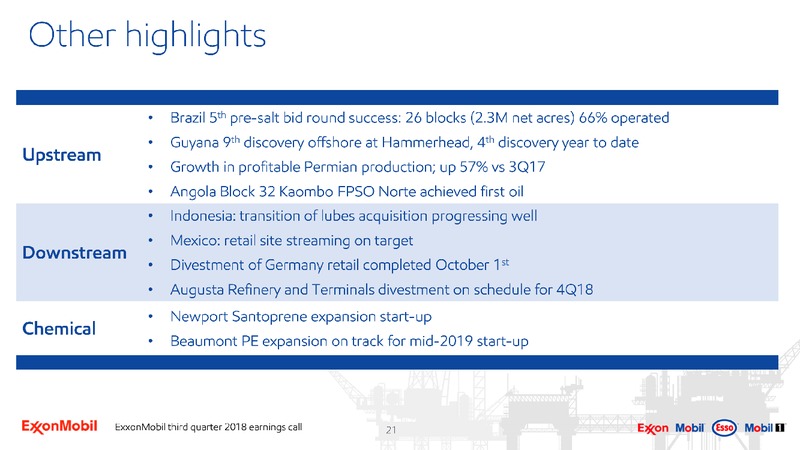
Other highlights
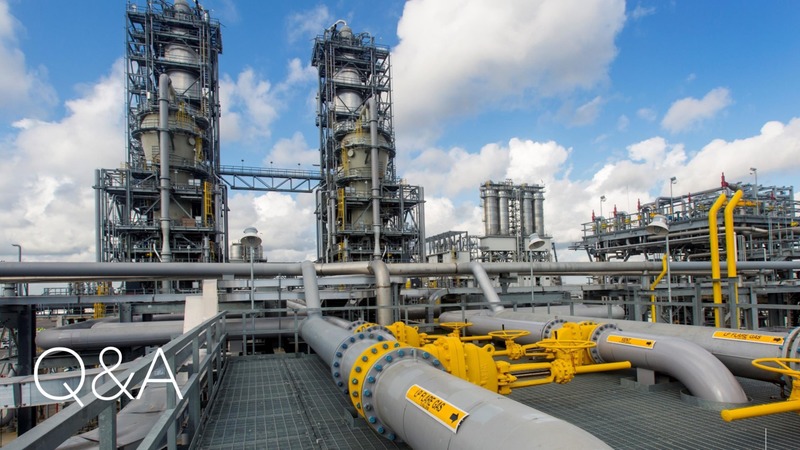
Q&A
Supplemental information
Supplemental information 1 Includes PP&E Adds of (5.2B) and net investments/advances of (0.2B) for 3Q18; includes PP&E Adds of (4.9B) and net investments/advances of 1.5B for 3Q17; includes PP&E Adds of (4.9B) and net…
 Loading...