A Core Energy Infrastructure Holding Unparalleled asset footprint: one of the largest energy infrastructure companies in North America CO2 S&T KM Canada Natural Gas Pipelines CO2 EOR 4%3% Largest natural gas transmission network in…
Compelling Investment Thesis Significant cash flow generation, significant value to shareholders 40 billion market capitalization One of the 10 largest energy companies in the S&P 500; Highly aligned management (14% ownership)…
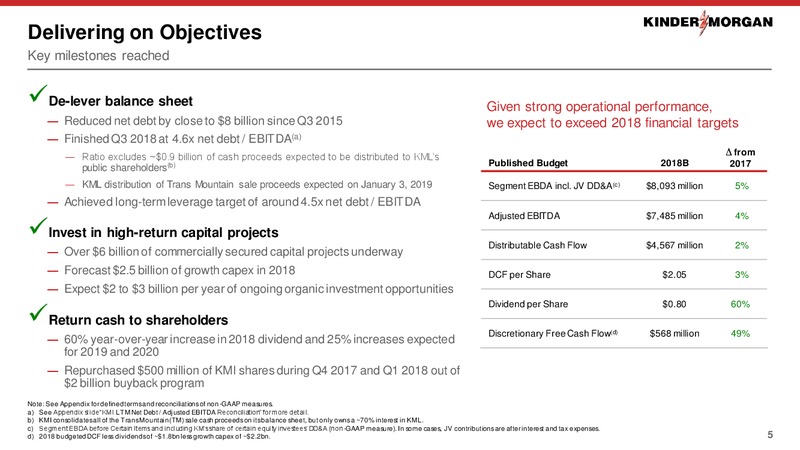
Delivering on Objectives Key milestones reached De-lever balance sheet Given strong operational performance, Reduced net debt by close to 8 billion since Q3 2015 we expect to exceed 2018 financial targets Finished Q3 2018 at 4.6x net…
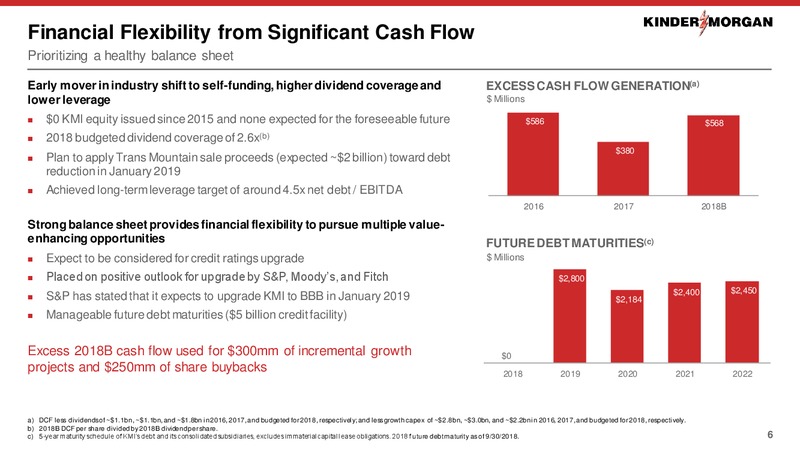
Financial Flexibility from Significant Cash Flow Prioritizing a healthy balance sheet Early mover in industry shift to self-funding, higher dividend coverage and EXCESS CASH FLOW GENERATION(a) lower leverage Millions 0 KMI equity…
Kinder Morgans Commitment to Shareholders Generate predictable, fee-based cash flows and leverage footprint to deliver growth Diversified, highly contracted asset base core to North American economy Stable, fee-based 96% of cash flows…
Positioned to Support Future of Natural Gas Kinder Morgan transports 40% of all natural gas consumed in the U.S. U.S. NATURAL GAS SUPPLY U.S. NATURAL GAS DEMAND Bcfd Bcfd Growth Marc./Utica, 24 Sector 2017 2027E Bcfd % Permian, 7…
Unmatched Natural Gas Network and Deliverability Strong fundamentals drive value on existing assets and create investment opportunities (Bcfd) 2017 2018E 2019E CIG throughput = Growing supply area U.S. Natural Gas Demand 80 89 95 TGP…
6.5bn of Commercially Secured Capital Projects Underway Significant opportunities primarily resulting from expansive natural gas footprint Demand Pull / KMI Capital Estimated Commercially Secured Capital Projects Supply Push ( billion)…
Growth Driver: Buildout of U.S. LNG Exports Multiple liquefaction and natural gas transport opportunities across KM footprint Global demand driving significant buildout of LNG export capabilities in the U.S. KM Network Reaches Multiple…
Project Highlight: Elba Island LNG Export Terminal Elba Liquefaction Company (ELC) (a) / Southern LNG Company (SLNG) Project Scope Liquefaction facilities (10 small-scale modular units) Ship loading facilities; boil-off gas…
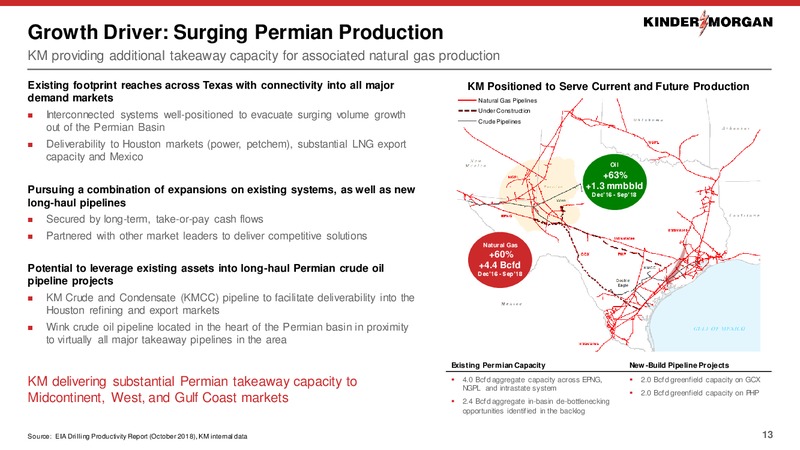
Growth Driver: Surging Permian Production KM providing additional takeaway capacity for associated natural gas production Existing footprint reaches across Texas with connectivity into all major KM Positioned to Serve Current and Future…
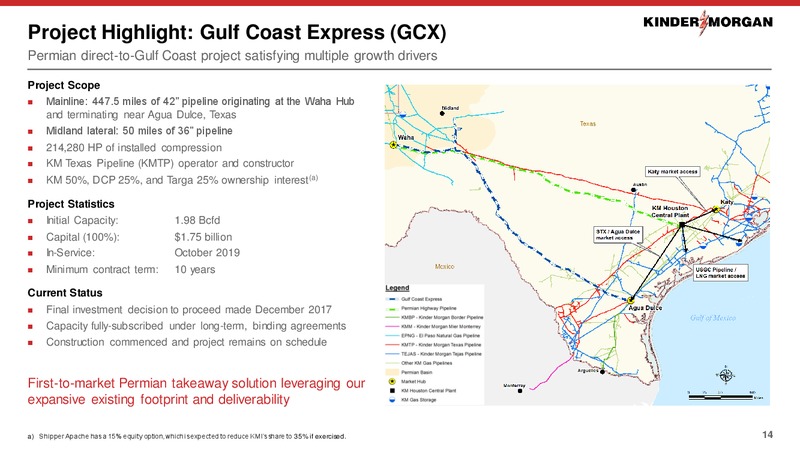
Project Highlight: Gulf Coast Express (GCX) Permian direct-to-Gulf Coast project satisfying multiple growth drivers Project Scope Mainline: 447.5 miles of 42 pipeline originating at the Waha Hub and terminating near Agua Dulce, Texas…
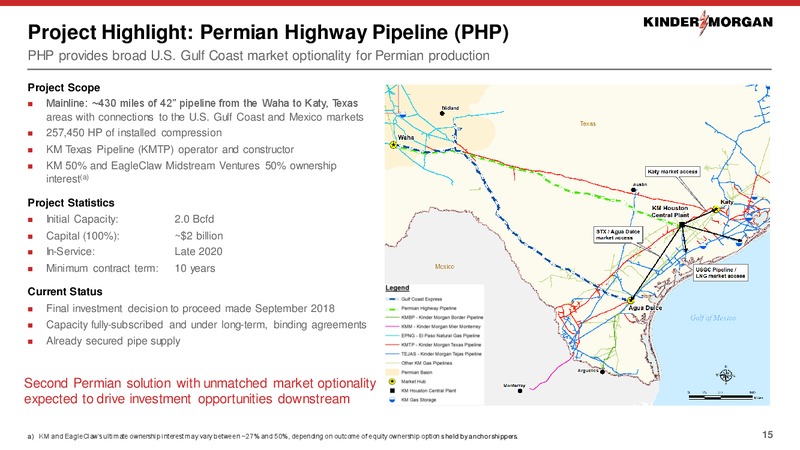
Project Highlight: Permian Highway Pipeline (PHP) PHP provides broad U.S. Gulf Coast market optionality for Permian production Project Scope Mainline: 430 miles of 42 pipeline from the Waha to Katy, Texas areas with connections to the…
Solid Liquids Fundamentals Attractive opportunities to supply U.S. products to consumers here and abroad GLOBAL LIQUIDS CONSUMPTION EXPECTED TO EXCEED GROWTH LED BY CHINA AND INDIA OVER NEXT TWO YEARS 100 MILLION BARRELS PER DAY BY 2019…
Positioned to Support U.S. Gulf Coast Exports The Houston Ship Channel is the premier refined products aggregation and market-clearing terminals hub KMs HSC position represents the largest independent refined Integrated Houston Ship…
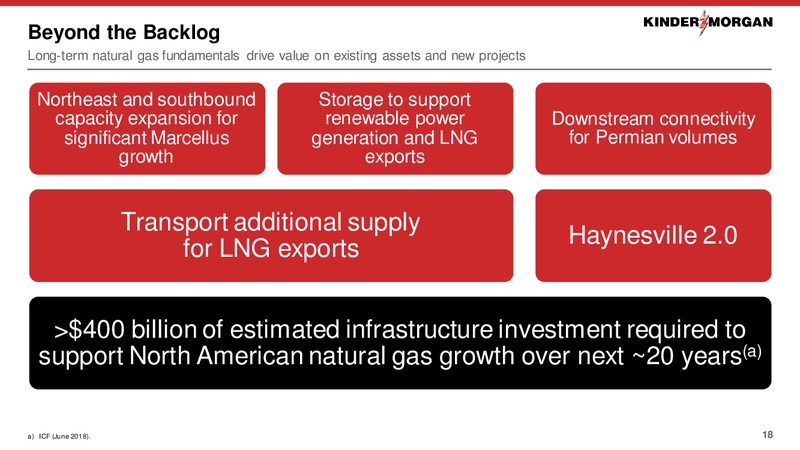
Beyond the Backlog Long-term natural gas fundamentals drive value on existing assets and new projects Northeast and southbound Storage to support capacity expansion for renewable power Downstream connectivity significant Marcellus…
Key Takeaways Run for shareholders, by shareholders Diversified energy Positioned for growth Financial flexibility to execute Delivering shareholder value infrastructure One of the 10 largest energy 6.5bn backlog primarily…
Appendix 21
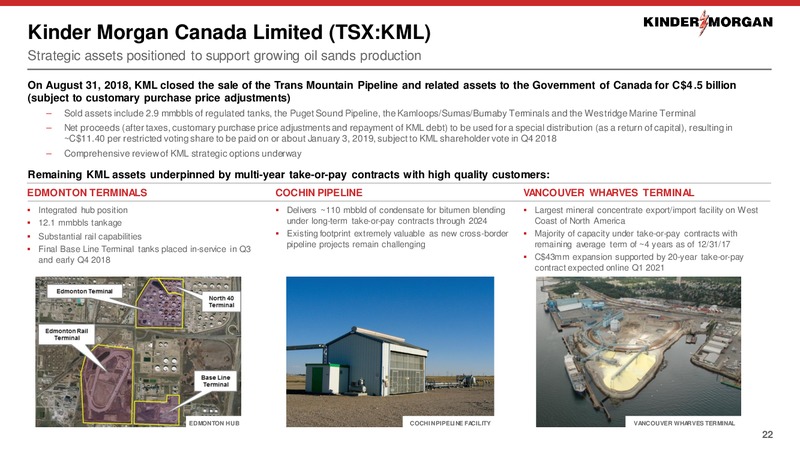
Kinder Morgan Canada Limited (TSX:KML) Strategic assets positioned to support growing oil sands production On August 31, 2018, KML closed the sale of the Trans Mountain Pipeline and related assets to the Government of Canada for C4 .5…
Long-Term Growth Drivers Summary Natural Gas Pipelines Products Pipelines Terminals CO2 Exports Steady demand for refined North American Logistics Solutions CO2 Supply LNG exports: liquefaction facilities products volumes on…
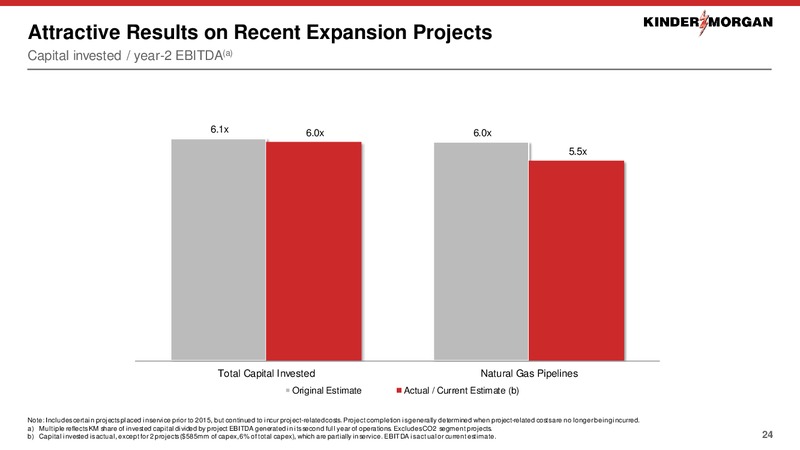
Attractive Results on Recent Expansion Projects Capital invested / year-2 EBITDA(a) 6.1x 6.0x 6.0x 5.5x Total Capital Invested Natural Gas Pipelines Original Estimate Actual / Current Estimate (b) Note: Includes certain…
Stable, Multi-Year Fee-Based Cash Flow 96% of 2018B cash flow are from take-or-pay and other fee-based contracts or hedged(a) 66% Fee-Based Take-or-Pay: highly dependable cash flow under multi-year contracts Entitled to payment…
Energy Toll Road Cash flow security with 90% from take-or-pay and other fee-based contracts Natural Gas Products Kinder Morgan Terminals CO2 Pipelines Pipelines Canada 18B EBDA %(a) 56% 15% 15% 11% 3%(a) 73% interstate pipelines 80%…
Environmental, Social and Governance (ESG) Committed to being a good corporate citizen Prioritizing ESG Everyday ESG-Related Achievements Operations Management System Published first stand-alone ESG Report in October 2018 Intentional,…
Asset Integrity and Safety are Top Priorities Kinder Morgans EHS metrics consistently outperform the industry Safe operation of our assets is mission critical to our long-term OUR SAFETY PERFORMANCE VS. INDUSTRY(a) success of safety…
KMI Business Risks Summary Regulatory FERC rate cases (Products Pipelines and Natural Gas Pipelines) Provincial, state, and local permitting issues CO2 crude oil production volumes Throughput on our volume-based assets Commodity…
Natural Gas Segment Outlook and Asset Overview Well-positioned: connecting key natural gas resources with major demand centers Project Backlog: 4.6 billion of identified growth projects over the 2018-2022 time period(a) Permian…
Highly-Contracted Natural Gas Pipelines Contracted capacity and term by region Contracted Average Term Region Capacity Remaining Storage 326 Bcf 2 yr, 11 mo NORTH Transport 19.3 Bcfd 6 yr, 3 mo Storage 52 Bcf 1 yr, 8 mo…
Products Segment Outlook and Asset Overview Products pipelines: stable, strategic assets Project Backlog: 0.1 billion of identified growth projects over the 2018-2019 time period(a) Additional condensate splitter processing…
Terminals Segment Outlook and Asset Overview A diversified system across liquid and bulk hubs and services Project Backlog: 0.1 billion to be completed in 2018-2021(a) Primarily remaining Base Line tanks Diesel tank expansion at Van…
CO2 Segment Outlook and Asset Overview Own and operate CO 2 for Enhanced Oil Recovery (EOR) Project Backlog: 1.7 billion of identified growth projects over the 2018-2023 time period(a) 1.3 billion related to Enhanced Oil Recovery (EOR)…
CO2 Segment Significant Returns and FCF Generating high returns and 6 billion in cumulative free cash flow IRR% 2000-2017 CUMULATIVE FCF GENERATION(a) 30% Billions 5.8 5.3 4.9 4.2 3.7 3.1 25% 2.7 20% 2012 2013 2014 2015…
KMI: 2018B Adjusted EBITDA ( in millions) 2018 2017 Change Adjusted EBITDA Budget Actual % Segment EBDA before Certain Items 7,707 7,359 348 5% Natural Gas Pipelines JV DD&A (a) 375 378 (3) -1% CO2 JV DD&A 8 8 0 0% Products…
KMI LTM Net Debt / Adjusted EBITDA Reconciliation ( in millions) September 30, December 31, 2018 2017 Net Debt (a) 33,410 36,409 Adjusted Net Debt (b) 34,544 36,624 Adjusted EBITDA Twelve Months Ended September 30, December 31,…
KMI GAAP Reconciliation ( in millions) Yr. Ended Yr. Ended Reconciliation of DCF 12/31/17 Reconciliation of Adjusted EBITDA 12/31/17 Net Income Available to Common Stockholders 27 Net Income 223 Certain Items 1,445 Certain Items…
 Loading...